Exhibit 99.1
OPPENHEIMER PRESENTATION May 2020
WHERE THE PROS GO TO GROW SAFE HARBOR STATEMENT This presentation is being provided for information purposes only and does not constitute an offer to sell or a solicitation of an offer to purchase any of the Company’s securities. This presentation is not intended, nor should it be distributed, for advertising purposes, nor is it intended for broadcast or publication to the general public. Any such offer of the Company’s securities will only be made in compliance with applicable state and federal securities laws pursuant to a prospectus or an offering memorandum and related offering documents which will be provided to qualified prospective investors upon request. This presentation may include predictions, estimates or other information that might be considered forward - looking within the meaning of applicable securities laws. While these forward - looking statements represent our current judgments, they are subject to risks and uncertainties that could cause actual results to differ materially. You are cautioned not to place undue reliance on these forward - looking statements, which reflect our opinions only as of the date of this presentation. Please keep in mind that we are not obligating ourselves to revise or publicly release the results of any revision to these forward - looking statements in light of new information or future events. When used herein, words such as "look forward," "believe," "continue," "building," or variations of such words and similar expressions are intended to identify forward - looking statements. Factors that could cause actual results to differ materially from those contemplated in any forward - looking statements made by us herein are often discussed in filings we make with the United States Securities and Exchange Commission, available at: www.sec.gov, and on our website, at: www.growgeneration.com. growgeneration.com 2
WHERE THE PROS GO TO GROW TABLE OF CONTENTS growgeneration.com 3 1) Company and Market Overview 2) Business Overview 3) Growth Strategy 4) Financials and Milestones

WHERE THE PROS GO TO GROW growgeneration.com 4 1) Company and Market Overview
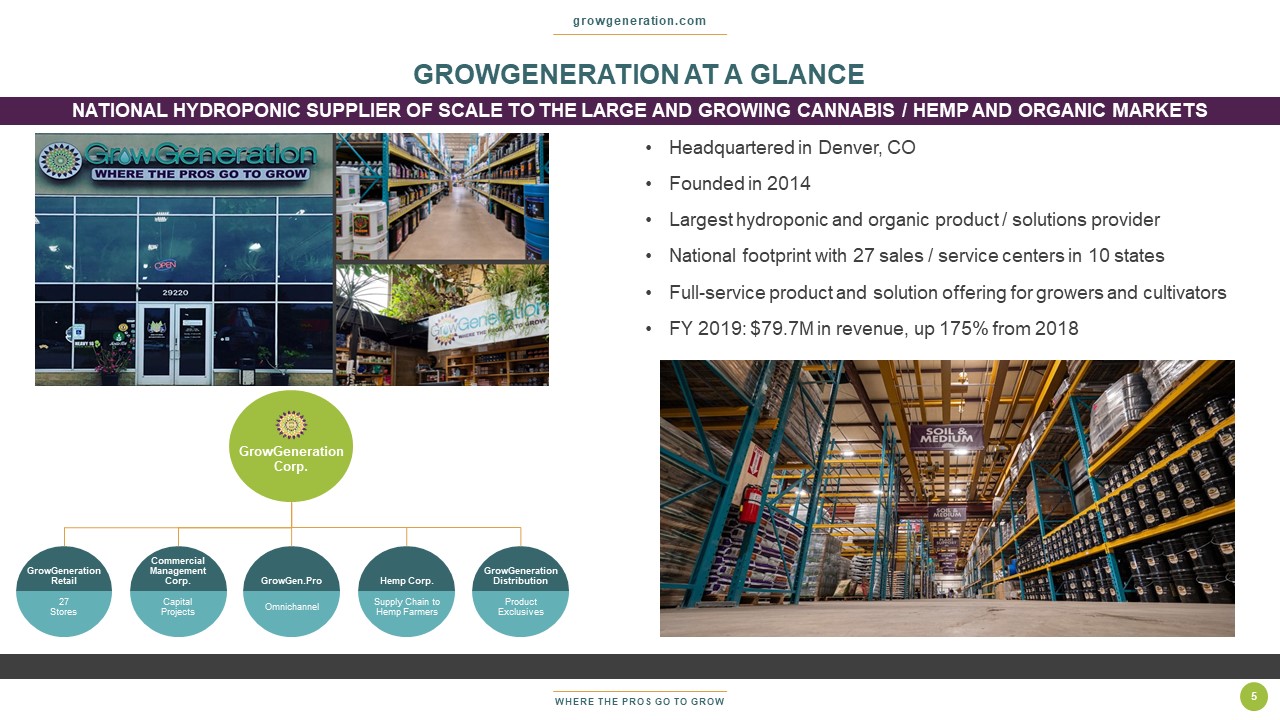
WHERE THE PROS GO TO GROW GROWGENERATION AT A GLANCE growgeneration.com 5 • Headquartered in Denver, CO • Founded in 2014 • Largest hydroponic and organic product / solutions provider • National footprint with 27 sales / service centers in 10 states • Full - service product and solution offering for growers and cultivators • FY 2019: $79.7M in revenue, up 175% from 2018 GrowGeneration Corp. GrowGeneration Retail 27 Stores Commercial Management Corp. Capital Projects GrowGen.Pro Omnichannel Hemp Corp. Supply Chain to Hemp Farmers GrowGeneration Distribution Product Exclusives NATIONAL HYDROPONIC SUPPLIER OF SCALE TO THE LARGE AND GROWING C ANNABIS / HEMP AND ORGANIC MARKETS
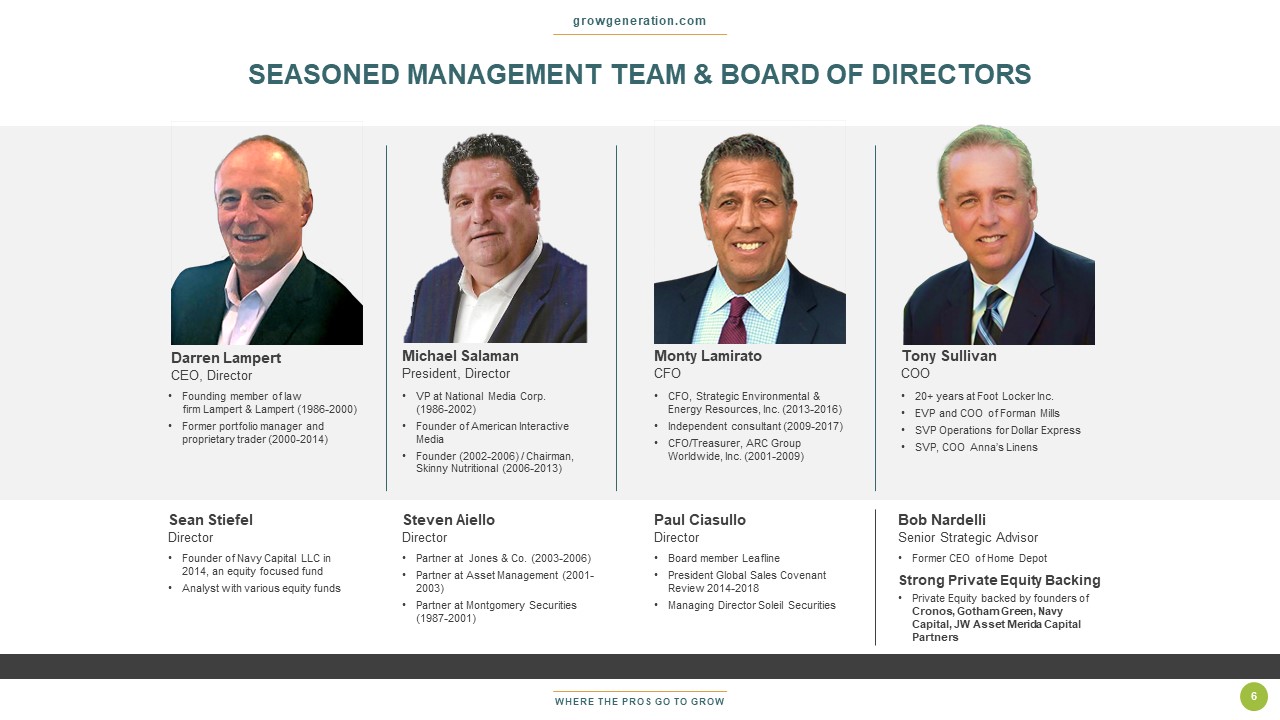
WHERE THE PROS GO TO GROW SEASONED MANAGEMENT TEAM & BOARD OF DIRECTORS growgeneration.com Darren Lampert CEO, Director • Founding member of law firm Lampert & Lampert (1986 - 2000) • Former portfolio manager and proprietary trader (2000 - 2014) Michael Salaman President, Director • VP at National Media Corp. (1986 - 2002) • Founder of American Interactive Media • Founder (2002 - 2006) / Chairman, Skinny Nutritional (2006 - 2013) Tony Sullivan COO • 20+ years at Foot Locker Inc. • EVP and COO of Forman Mills • SVP Operations for Dollar Express • SVP, COO Anna’s Linens Monty Lamirato CFO • CFO, Strategic Environmental & Energy Resources, Inc. (2013 - 2016) • Independent consultant (2009 - 2017) • CFO/Treasurer, ARC Group Worldwide, Inc. (2001 - 2009) 6 Sean Stiefel Director • Founder of Navy Capital LLC in 2014, an equity focused fund • Analyst with various equity funds Steven Aiello Director • Partner at Jones & Co. (2003 - 2006) • Partner at Asset Management (2001 - 2003) • Partner at Montgomery Securities (1987 - 2001) Paul Ciasullo Director Strong Private Equity Backing • Private Equity backed by founders of Cronos, Gotham Green, Navy Capital, JW Asset Merida Capital Partners Bob Nardelli Senior Strategic Advisor • Former CEO of Home Depot
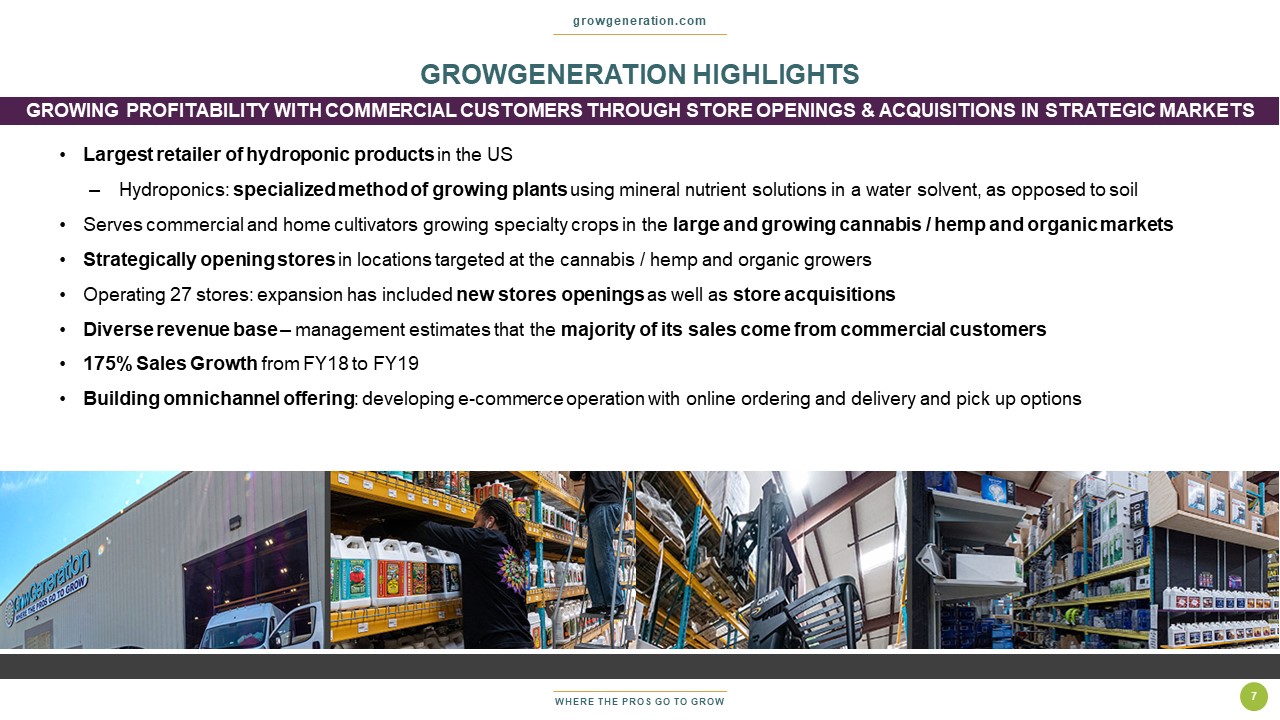
WHERE THE PROS GO TO GROW growgeneration.com 7 • Largest retailer of hydroponic products in the US – Hydroponics: specialized method of growing plants using mineral nutrient solutions in a water solvent, as opposed to soil • Serves commercial and home cultivators growing specialty crops in the large and growing cannabis / hemp and organic markets • Strategically opening stores in locations targeted at the cannabis / hemp and organic growers • Operating 27 stores: expansion has included new stores openings as well as store acquisitions • Diverse revenue base – management estimates that the majority of its sales come from commercial customers • 175% Sales Growth from FY18 to FY19 • Building omnichannel offering : developing e - commerce operation with online ordering and delivery and pick up options GROWGENERATION HIGHLIGHTS GROWING PROFITABILITY WITH COMMERCIAL CUSTOMERS THROUGH STORE OP ENINGS & ACQUISITIONS IN STRATEGIC MARKETS
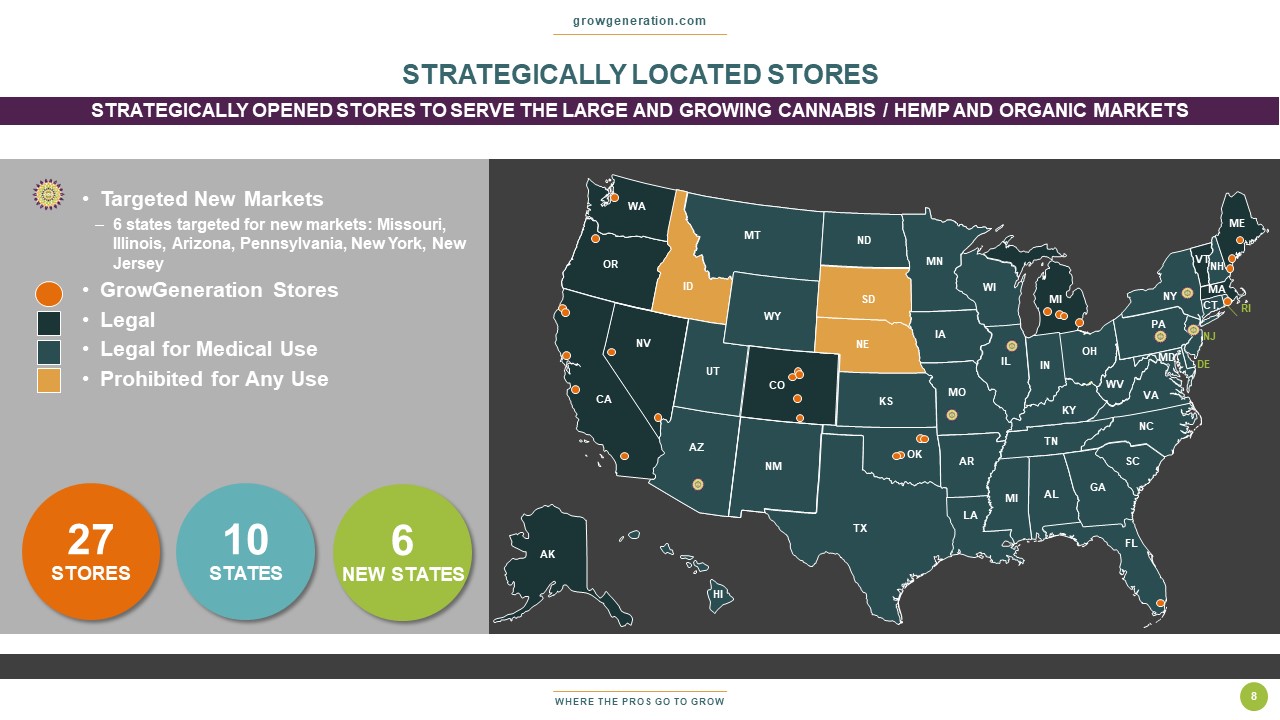
WHERE THE PROS GO TO GROW growgeneration.com 8 27 STORES 10 STATES HI AL AZ AR CA CO FL GA ID IL IN IA KS KY LA ME MI MN MI MO MT NE NV NM NY NC ND OH OK OR PA SC SD TN TX UT VA WA WV WI WY MD NJ CT VT NH MA DE RI AK • Targeted New Markets – 6 states targeted for new markets: Missouri, Illinois, Arizona, Pennsylvania, New York, New Jersey • GrowGeneration Stores • Legal • Legal for Medical Use • Prohibited for Any Use 6 NEW STATES STRATEGICALLY LOCATED STORES STRATEGICALLY OPENED STORES TO SERVE THE LARGE AND GROWING CANNA BIS / HEMP AND ORGANIC MARKETS
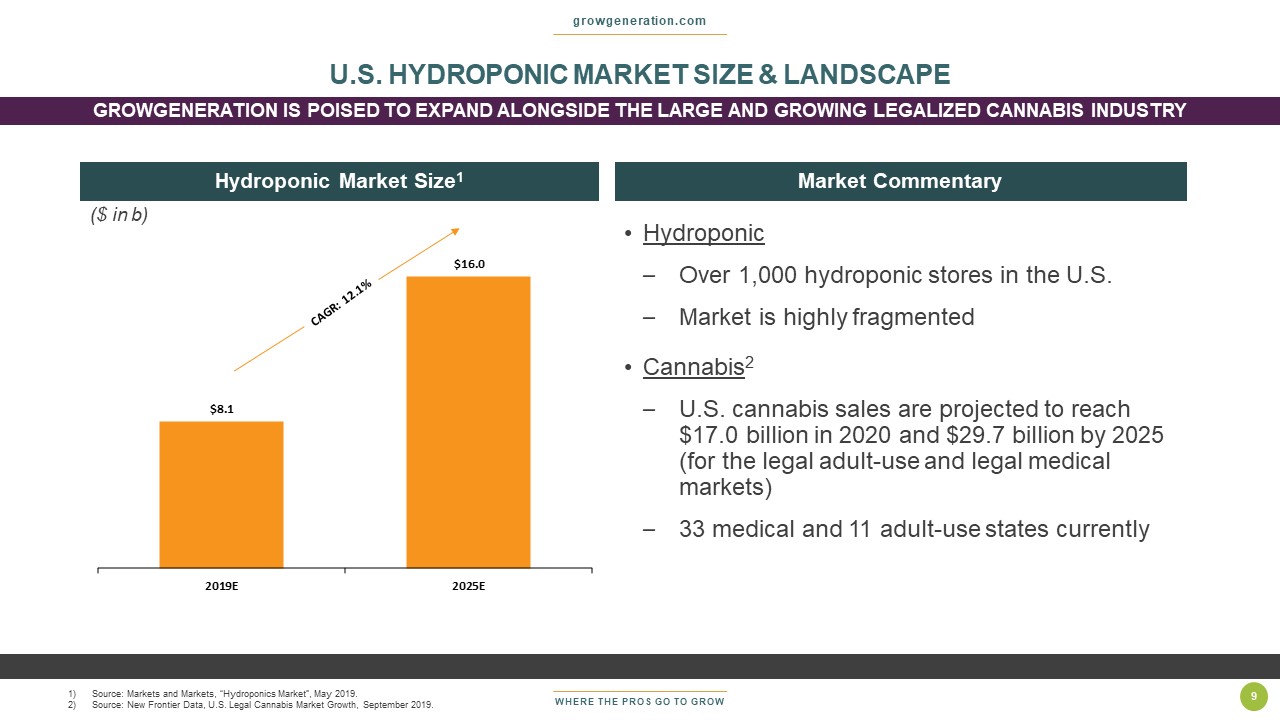
WHERE THE PROS GO TO GROW growgeneration.com 9 Hydroponic Market Size 1 Market Commentary • Hydroponic – Over 1,000 hydroponic stores in the U.S. – Market is highly fragmented • Cannabis 2 – U.S. cannabis sales are projected to reach $17.0 billion in 2020 and $29.7 billion by 2025 (for the legal adult - use and legal medical markets) – 33 medical and 11 adult - use states currently 1) Source: Markets and Markets, “Hydroponics Market”, May 2019. 2) Source: New Frontier Data, U.S. Legal Cannabis Market Growth, September 2019. U.S. HYDROPONIC MARKET SIZE & LANDSCAPE GROWGENERATION IS POISED TO EXPAND ALONGSIDE THE LARGE AND GROWI NG LEGALIZED CANNABIS INDUSTRY $8.1 $16.0 2019E 2025E ($ in b)

WHERE THE PROS GO TO GROW growgeneration.com 10 2) Business Overview
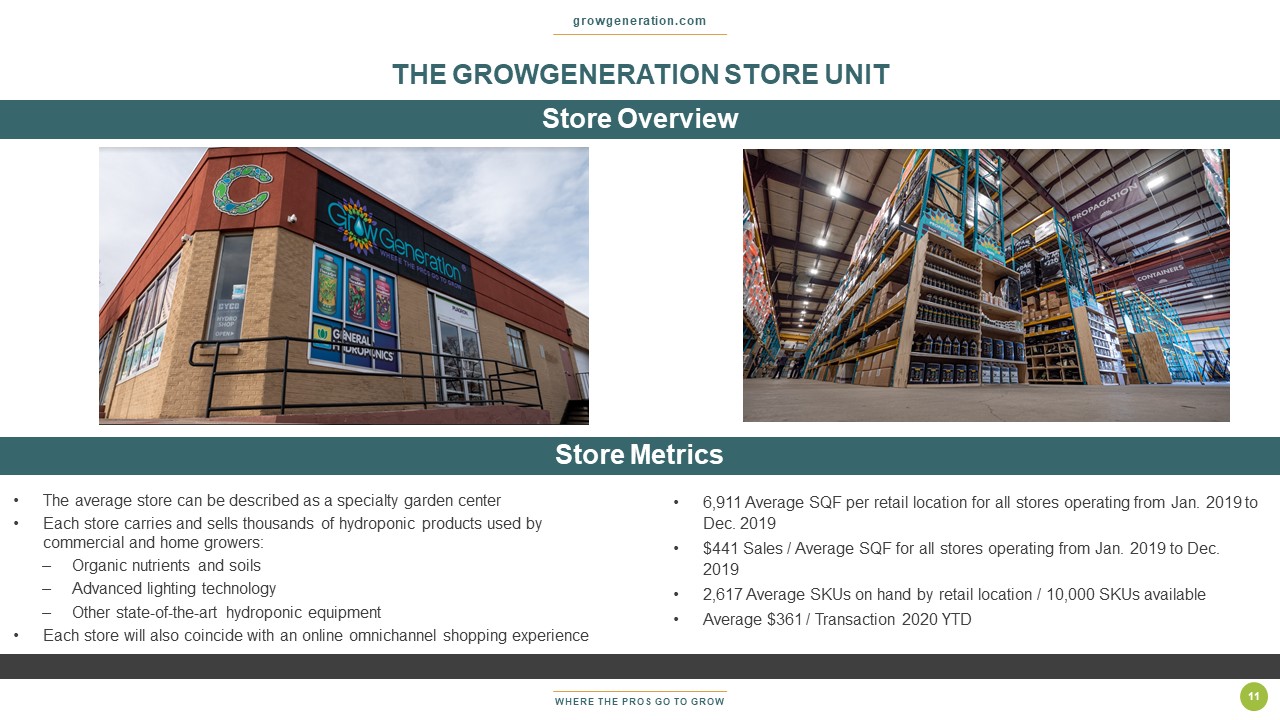
WHERE THE PROS GO TO GROW THE GROWGENERATION STORE UNIT growgeneration.com 11 Store Overview Store Metrics • 6,911 Average SQF per retail location for all stores operating from Jan. 2019 to Dec. 2019 • $441 Sales / Average SQF for all stores operating from Jan. 2019 to Dec. 2019 • 2,617 Average SKUs on hand by retail location / 10,000 SKUs available • Average $361 / Transaction 2020 YTD • The average store can be described as a specialty garden center • Each store carries and sells thousands of hydroponic products used by commercial and home growers: – Organic nutrients and soils – Advanced lighting technology – Other state - of - the - art hydroponic equipment • Each store will also coincide with an online omnichannel shopping experience

WHERE THE PROS GO TO GROW growgeneration.com 12 Diverse Product Base 28% 21% 19% 14% 6% • Over 10,000+ SKUs available, sold by knowledgeable sales staff • Extremely diversified product offering • ~60% of revenues are from consumable products, driving repeat purchases and foot traffic • Non - consumables – Environmental Controls – Portion of Lighting – Portion of Harvest – Portion of Hydroponic Systems • Lighting, ventilation, dehumidifiers and other key products are needed for new builds Containers 5% Environmental Controls 14% Garden Tools and Accessories 5% Harvest 2% Hydroponic Systems 6% Lighting 21% Growing Media 14% Nutrients and Additives 27% Plant Health and Safety 3% Propagation 2% PRODUCT MIX PRODUCTS ARE KEY FOR CUSTOMERS’ NEW BUILDS AS WELL AS MAINTAININ G EFFICIENT OPERATIONS (CONSUMABLES) 2019 Product Mix
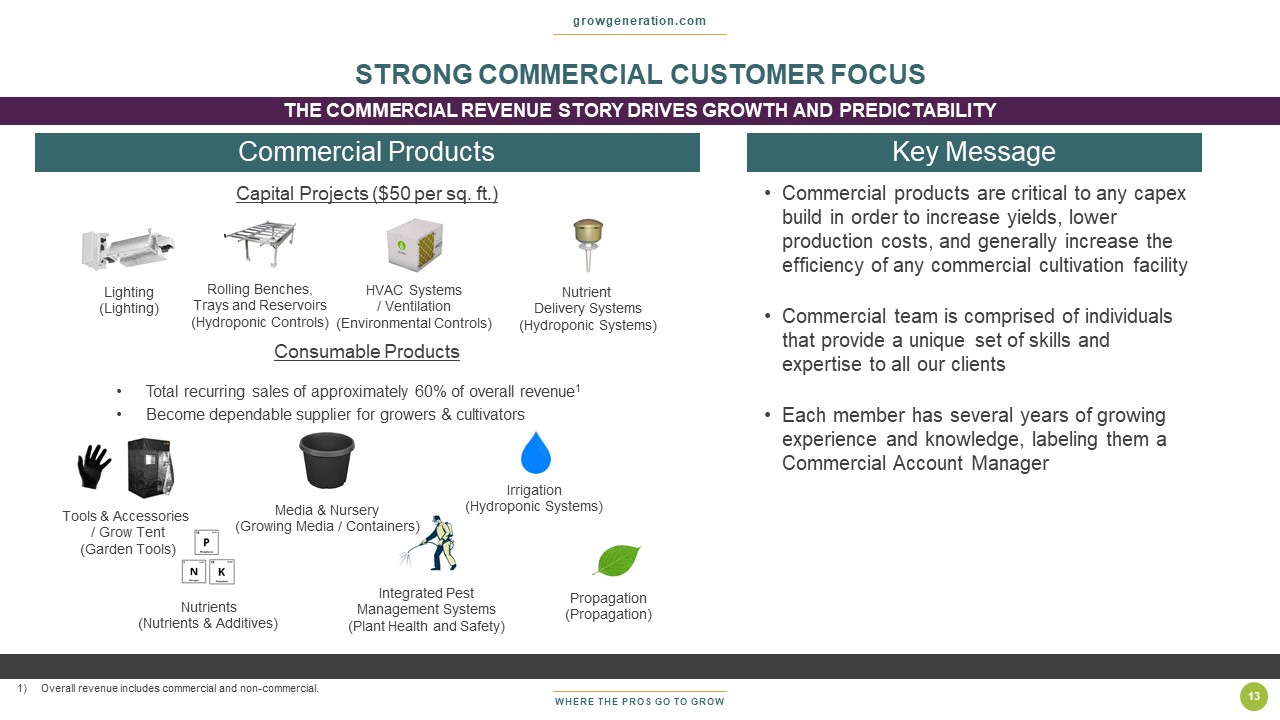
WHERE THE PROS GO TO GROW growgeneration.com 13 Commercial Products Capital Projects ($50 per sq. ft.) Consumable Products • Total recurring sales of approximately 60% of overall revenue 1 • Become dependable supplier for growers & cultivators Lighting (Lighting) Rolling Benches, Trays and Reservoirs (Hydroponic Controls) Nutrient Delivery Systems (Hydroponic Systems) HVAC Systems / Ventilation (Environmental Controls) Integrated Pest Management Systems (Plant Health and Safety) Media & Nursery (Growing Media / Containers) Propagation (Propagation) Tools & Accessories / Grow Tent (Garden Tools) Irrigation (Hydroponic Systems) Nutrients (Nutrients & Additives) • Commercial products are critical to any capex build in order to increase yields, lower production costs, and generally increase the efficiency of any commercial cultivation facility • Commercial team is comprised of individuals that provide a unique set of skills and expertise to all our clients • Each member has several years of growing experience and knowledge, labeling them a Commercial Account Manager Key Message STRONG COMMERCIAL CUSTOMER FOCUS THE COMMERCIAL REVENUE STORY DRIVES GROWTH AND PREDICTABILITY 1) Overall revenue includes commercial and non - commercial.

WHERE THE PROS GO TO GROW growgeneration.com 14 • The private label program, under the Sunleaves brand, began to be stocked on shelves and online in Q4 2019 • Initial private label lineup includes a one - part micro and macro nutrient+ Cal mag powder line, for both cannabis and hemp farmers, a silica+ micronutrient booster and a root stimulant • Private label products represented 2% of revenue in 2019 • Products have a higher gross margin profile • Additives work in combination with all major brand name nutrient systems BIG OPPORTUNITY IN PRIVATE LABEL PRODUCTS
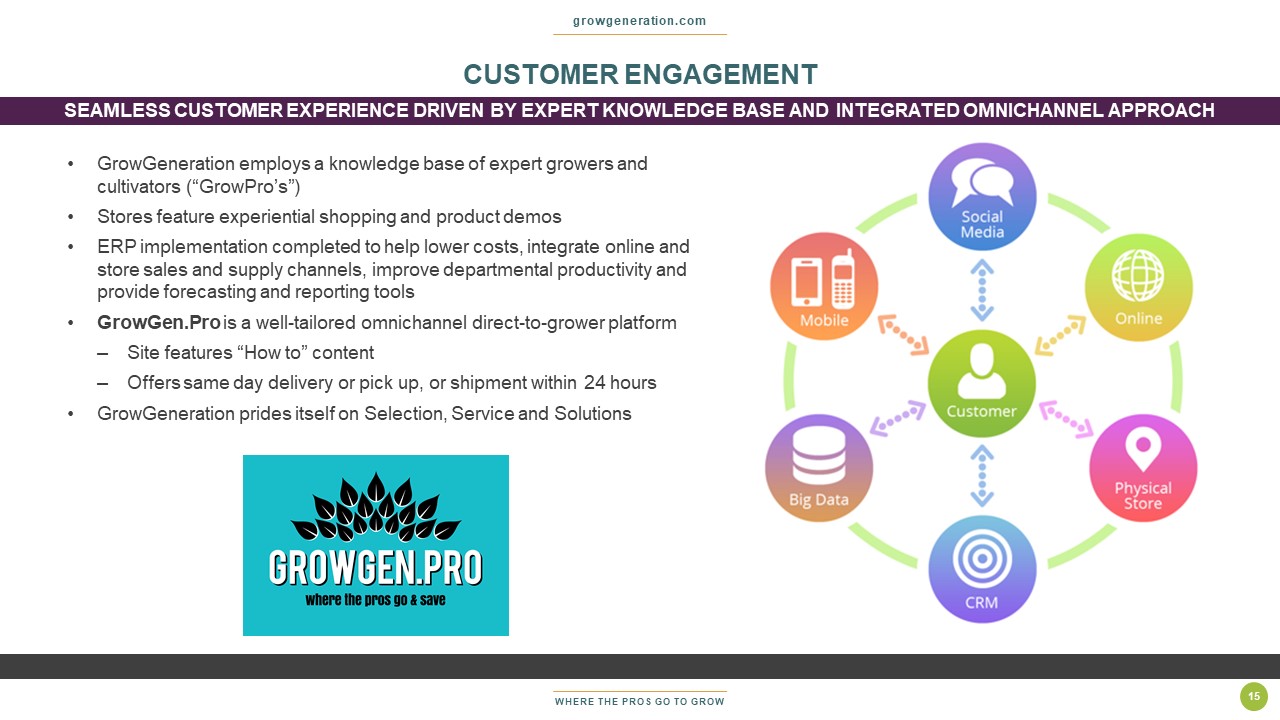
WHERE THE PROS GO TO GROW growgeneration.com 15 • GrowGeneration employs a knowledge base of expert growers and cultivators (“GrowPro’s”) • Stores feature experiential shopping and product demos • ERP implementation completed to help lower costs, integrate online and store sales and supply channels, improve departmental productivity and provide forecasting and reporting tools • GrowGen.Pro is a well - tailored omnichannel direct - to - grower platform – Site features “How to” content – Offers same day delivery or pick up, or shipment within 24 hours • GrowGeneration prides itself on Selection, Service and Solutions CUSTOMER ENGAGEMENT SEAMLESS CUSTOMER EXPERIENCE DRIVEN BY EXPERT KNOWLEDGE BASE AND INTEGRATED OMNICHANNEL APPROACH
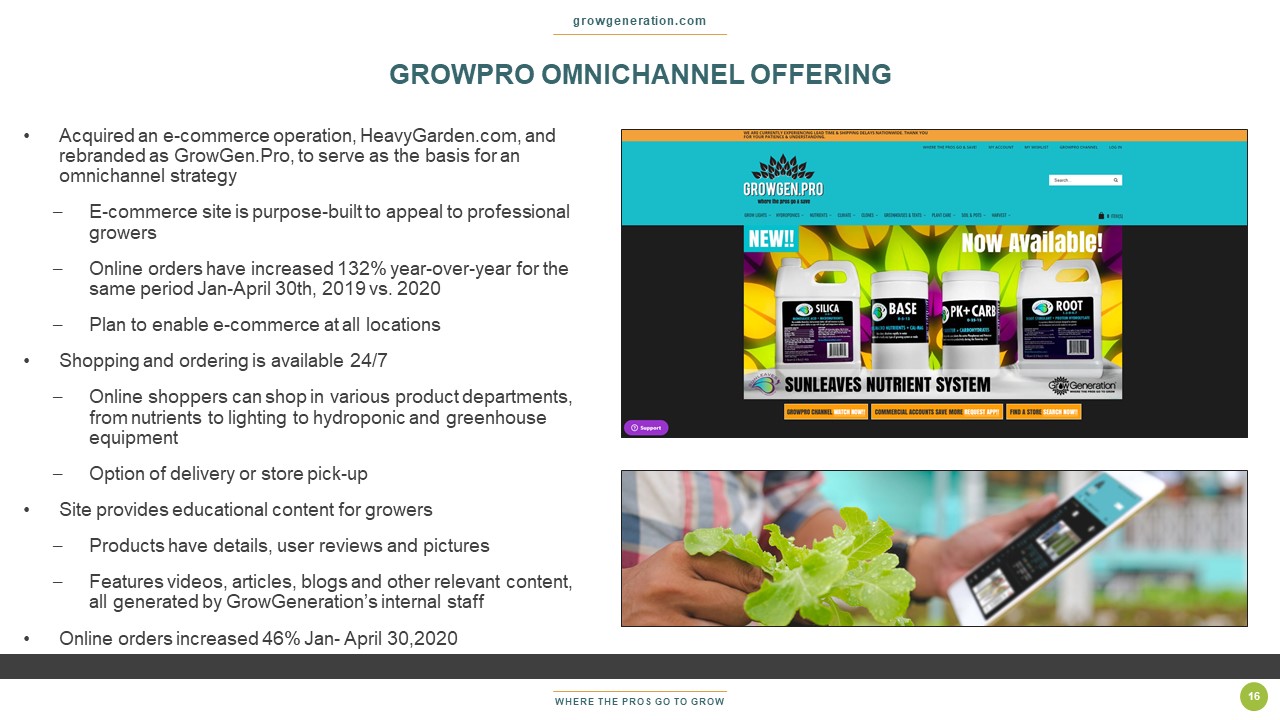
WHERE THE PROS GO TO GROW growgeneration.com 16 • Acquired an e - commerce operation, HeavyGarden.com, and rebranded as GrowGen.Pro, to serve as the basis for an omnichannel strategy – E - commerce site is purpose - built to appeal to professional growers – Online orders have increased 132% year - over - year for the same period Jan - April 30th, 2019 vs. 2020 – Plan to enable e - commerce at all locations • Shopping and ordering is available 24/7 – Online shoppers can shop in various product departments, from nutrients to lighting to hydroponic and greenhouse equipment – Option of delivery or store pick - up • Site provides educational content for growers – Products have details, user reviews and pictures – Features videos, articles, blogs and other relevant content, all generated by GrowGeneration’s internal staff • Online orders increased 46% Jan - April 30,2020 GROWPRO OMNICHANNEL OFFERING
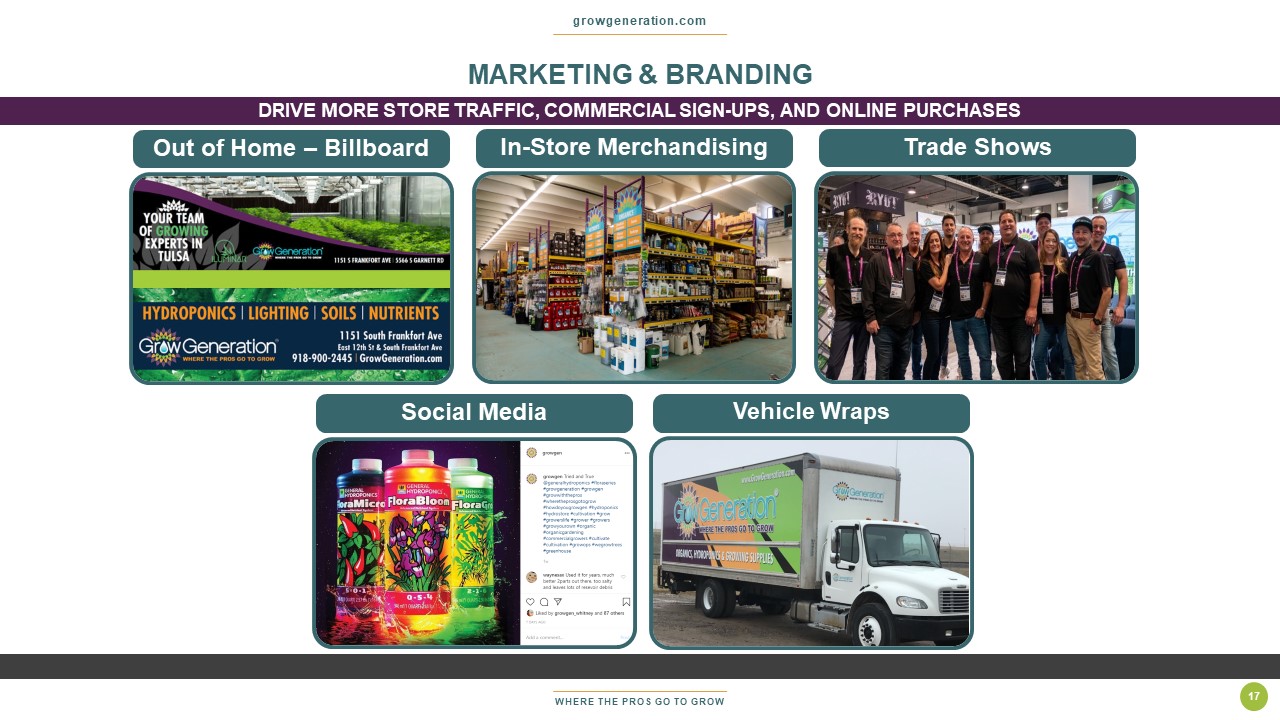
WHERE THE PROS GO TO GROW growgeneration.com 17 Out of Home – Billboard In - Store Merchandising Trade Shows Social Media Vehicle Wraps MARKETING & BRANDING DRIVE MORE STORE TRAFFIC, COMMERCIAL SIGN - UPS, AND ONLINE PURCHA SES

WHERE THE PROS GO TO GROW growgeneration.com 18 • GrowGeneration has continued operating – Deemed an “essential” supplier to the agricultural industry • Adjusted operations to ensure the safety of customers and employees – Successfully initiated curbside pickup and will - call procedures • GrowGeneration stores continue to perform – New stores in Portland, Miami, and Tulsa are contributing quarter - over - quarter growth • Strategically focused on internal development during this period – Focused on new initiatives and efficiencies operationally including private label products, same store sales, and e - commerce COVID - 19 UPDATE
WHERE THE PROS GO TO GROW growgeneration.com 19 3) Growth Strategy
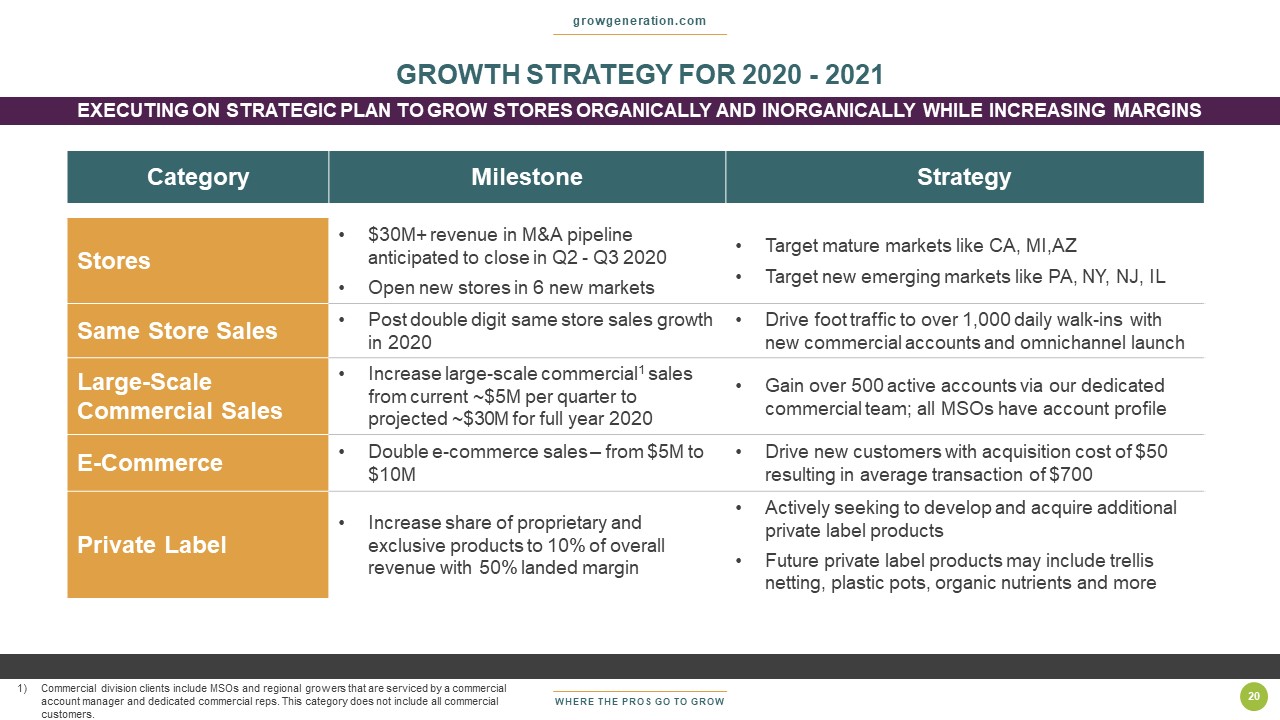
WHERE THE PROS GO TO GROW growgeneration.com 20 Category Milestone Strategy Stores • $30M+ revenue in M&A pipeline anticipated to close in Q2 - Q3 2020 • Open new stores in 6 new markets • Target mature markets like CA, MI,AZ • Target new emerging markets like PA, NY, NJ, IL Same Store Sales • Post double digit same store sales growth in 2020 • Drive foot traffic to over 1,000 daily walk - ins with new commercial accounts and omnichannel launch Large - Scale Commercial Sales • Increase large - scale commercial 1 sales from current ~$5M per quarter to projected ~$30M for full year 2020 • Gain over 500 active accounts via our dedicated commercial team; all MSOs have account profile E - Commerce • Double e - commerce sales – from $5M to $10M • Drive new customers with acquisition cost of $50 resulting in average transaction of $700 Private Label • Increase share of proprietary and exclusive products to 10% of overall revenue with 50% landed margin • Actively seeking to develop and acquire additional private label products • Future private label products may include trellis netting, plastic pots, organic nutrients and more GROWTH STRATEGY FOR 2020 - 2021 EXECUTING ON STRATEGIC PLAN TO GROW STORES ORGANICALLY AND INORG ANICALLY WHILE INCREASING MARGINS 1) Commercial division clients include MSOs and regional growers that are serviced by a commercial account manager and dedicated commercial reps. This category does not include all commercial customers.
WHERE THE PROS GO TO GROW growgeneration.com 21 4) Financials and Milestones
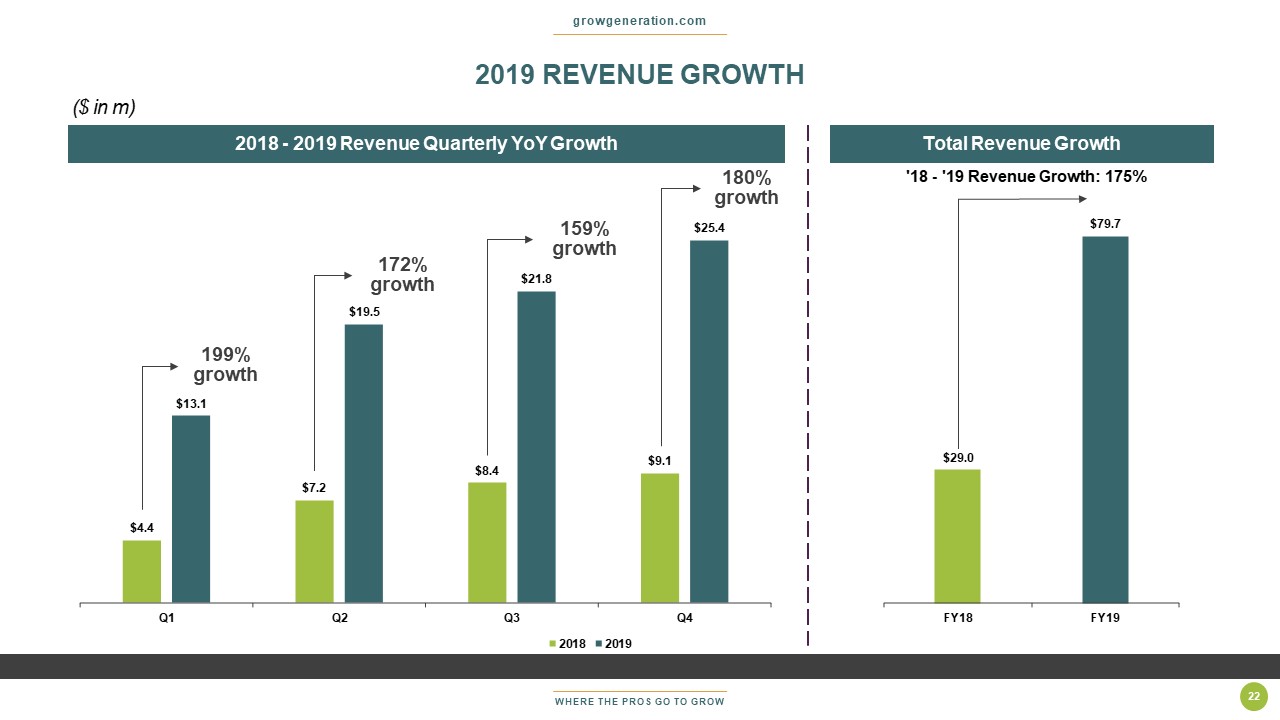
WHERE THE PROS GO TO GROW growgeneration.com 22 2019 REVENUE GROWTH $4.4 $7.2 $8.4 $9.1 $13.1 $19.5 $21.8 $25.4 Q1 Q2 Q3 Q4 2018 2019 2018 - 2019 Revenue Quarterly YoY Growth $29.0 $79.7 FY18 FY19 '18 - '19 Revenue Growth: 175% Total Revenue Growth 199% growth 172% growth 159% growth 180% growth ($ in m) Dec-18 Dec-19 Sales $29.0 $79.7 Cost of Goods Sold 22.6 57.2 Gross Profit $6.4 $22.6 Operating Expenses Store Operations 5.2 10.1 General and Administrative 1.6 3.2 Share Based Compensation 1.9 2.5 Depreciation and Amortization 0.4 1.0 Salaries and Related Expenses 1.6 3.6 Total Operating Expenses $10.7 $20.4 Operating Income (Loss) ($4.3) $2.1 Other Income (Expense) Miscellaneous Income (Expense) 0.1 (0.0) Interest Income 0.1 0.1 Interest Expense (0.0) (0.0) Amortization of Debt Discount (1.0) (0.4) Total Other Income (Expense) ($0.8) ($0.3) Net Income (Loss) ($5.1) $1.9

WHERE THE PROS GO TO GROW SAME STORE SALES growgeneration.com 23 • Same store sales +36% 2019 YoY • Same store sales $13.0M FY 2019 • Same store sales grew 62% in Q4 2019 • Double - digit projected 2020 same store sales growth Same Store Sales 43.0% 3.4% - 20.8% - 4.0% 21.6% - 5.1% 41.8% 22.9% 48.0% 62.0% 36.4% FY 2017 Q1 2018 Q2 2018 Q3 2018 Q4 2018 FY 2018 Q1 2019 Q2 2019 Q3 2019 Q4 2019 FY 2019
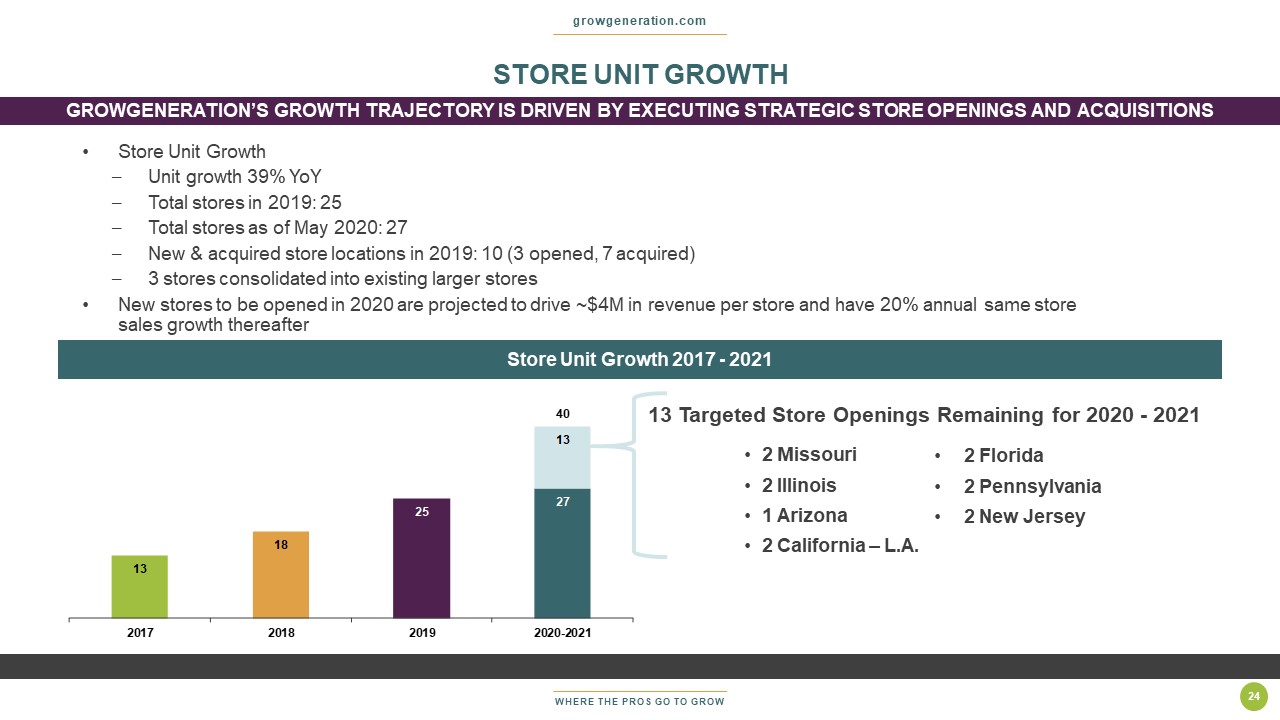
WHERE THE PROS GO TO GROW growgeneration.com 24 • Store Unit Growth – Unit growth 39% YoY – Total stores in 2019: 25 – Total stores as of May 2020: 27 – New & acquired store locations in 2019: 10 (3 opened, 7 acquired) – 3 stores consolidated into existing larger stores • New stores to be opened in 2020 are projected to drive ~$4M in revenue per store and have 20% annual same store sales growth thereafter Store Unit Growth 2017 - 2021 13 18 25 27 13 40 2017 2018 2019 2020-2021 13 Targeted Store Openings Remaining for 2020 - 2021 • 2 Florida • 2 Pennsylvania • 2 New Jersey • 2 Missouri • 2 Illinois • 1 Arizona • 2 California – L.A. STORE UNIT GROWTH GROWGENERATION’S GROWTH TRAJECTORY IS DRIVEN BY EXECUTING STRATE GIC STORE OPENINGS AND ACQUISITIONS
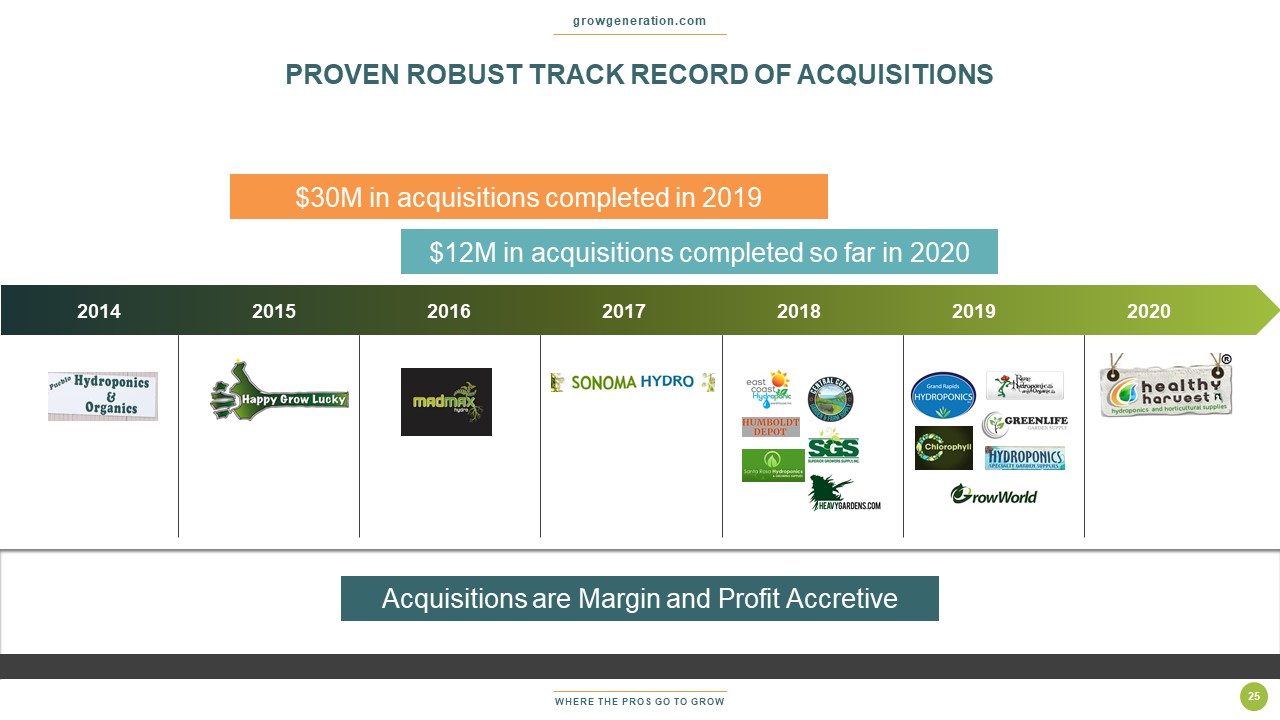
WHERE THE PROS GO TO GROW PROVEN ROBUST TRACK RECORD OF ACQUISITIONS growgeneration.com 2014 2015 2016 2017 2018 2019 2020 $30M in acquisitions completed in 2019 $12M in acquisitions completed so far in 2020 Acquisitions are Margin and Profit Accretive 25
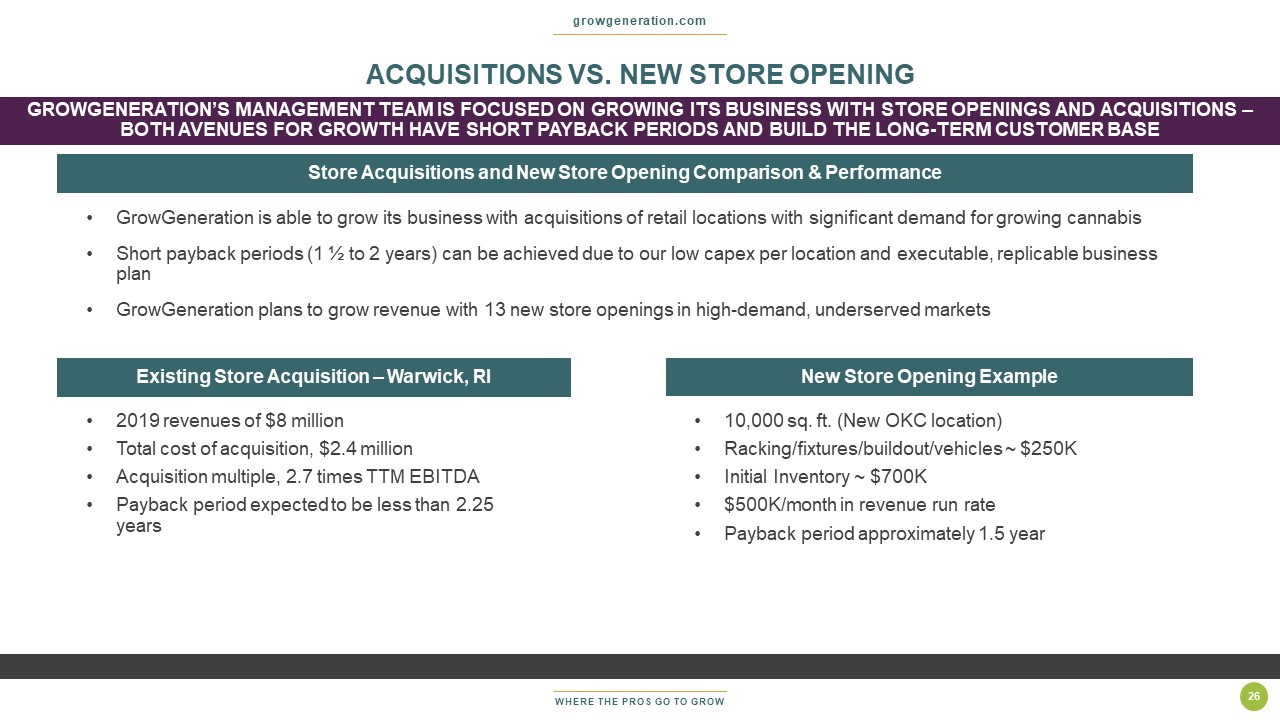
WHERE THE PROS GO TO GROW growgeneration.com • 2019 revenues of $8 million • Total cost of acquisition, $2.4 million • Acquisition multiple, 2.7 times TTM EBITDA • Payback period expected to be less than 2.25 years • 10,000 sq. ft. (New OKC location) • Racking/fixtures/buildout/vehicles ~ $250K • Initial Inventory ~ $700K • $500K/month in revenue run rate • Payback period approximately 1.5 year 26 Store Acquisitions and New Store Opening Comparison & Performance • GrowGeneration is able to grow its business with acquisitions of retail locations with significant demand for growing cannabi s • Short payback periods (1 ½ to 2 years) can be achieved due to our low capex per location and executable, replicable business plan • GrowGeneration plans to grow revenue with 13 new store openings in high - demand, underserved markets Existing Store Acquisition – Warwick, RI New Store Opening Example ACQUISITIONS VS. NEW STORE OPENING GROWGENERATION’S MANAGEMENT TEAM IS FOCUSED ON GROWING ITS BUSIN ESS WITH STORE OPENINGS AND ACQUISITIONS – BOTH AVENUES FOR GROWTH HAVE SHORT PAYBACK PERIODS AND BUILD THE LONG - TERM CUSTOMER BASE

WHERE THE PROS GO TO GROW growgeneration.com 27 Projected Revenue Estimated Adjusted EBITDA 4 - Wall Economics and Adjusted EBITDA $14 $29 $80 $130 $181 2017 2018 2019 2020E 2021E $6.6 $13.5 $22.0 2019 2020E 2021E 29% 12% 17% 8% 9% 30% 12% 18% 7% 11% Gross Profit Operating Expenses Operating Income G&A Adjusted EBITDA 2019 2020E 2019 Revenue $80M +$51 million or 175% vs 2018 Q4 2019 Revenue $25M +$16 million vs Q4 2018 Same Store Sales +62% Q4 2019 vs Q4 2018 Same Store Sales +36% 2019 vs 2018 10 New & Acquired Store Locations in 2019 ($ in m) Dec-18 Dec-19 Sales $29.0 $79.7 Cost of Goods Sold 22.6 57.2 Gross Profit $6.4 $22.6 Operating Expenses Store Operations 5.2 10.1 General and Administrative 1.6 3.2 Share Based Compensation 1.9 2.5 Depreciation and Amortization 0.4 1.0 Salaries and Related Expenses 1.6 3.6 Total Operating Expenses $10.7 $20.4 Operating Income (Loss) ($4.3) $2.1 Other Income (Expense) Miscellaneous Income (Expense) 0.1 (0.0) Interest Income 0.1 0.1 Interest Expense (0.0) (0.0) Amortization of Debt Discount (1.0) (0.4) Total Other Income (Expense) ($0.8) ($0.3) Net Income (Loss) ($5.1) $1.9 FINANCIAL HIGHLIGHTS

WHERE THE PROS GO TO GROW growgeneration.com 28 Appendix
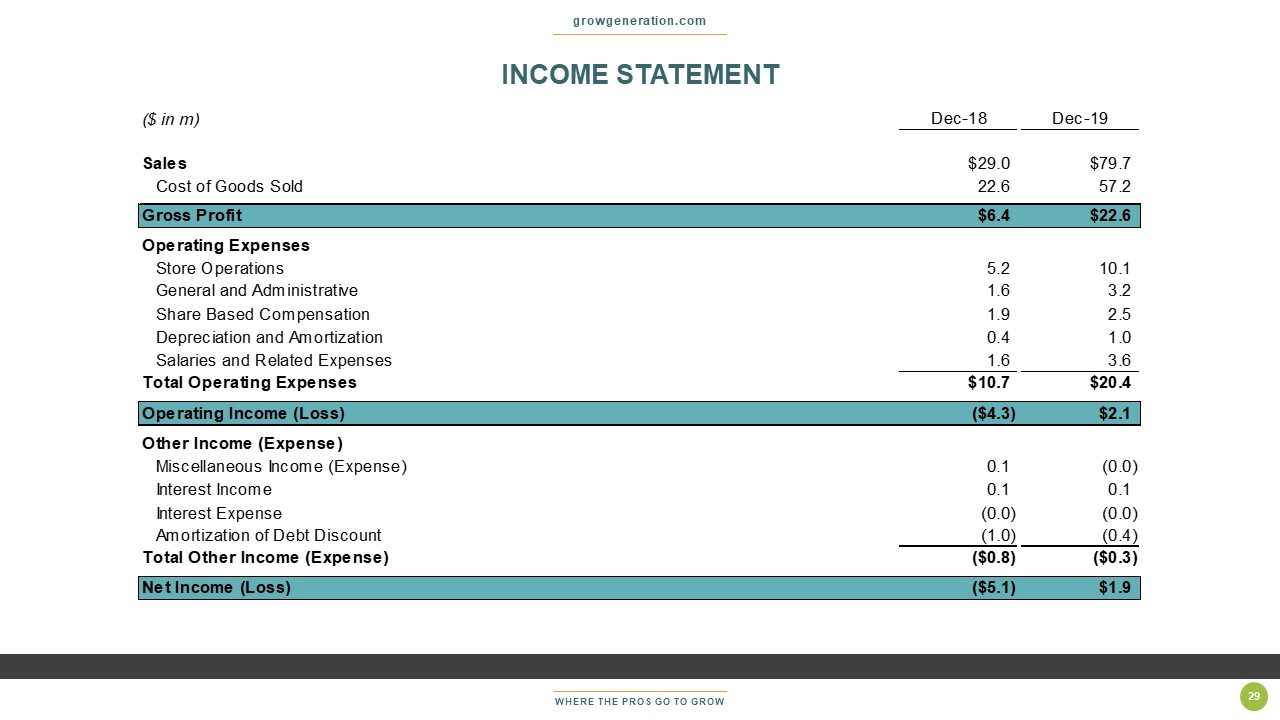
WHERE THE PROS GO TO GROW growgeneration.com 29 INCOME STATEMENT ($ in m) Dec-18 Dec-19 Sales $29.0 $79.7 Cost of Goods Sold 22.6 57.2 Gross Profit $6.4 $22.6 Operating Expenses Store Operations 5.2 10.1 General and Administrative 1.6 3.2 Share Based Compensation 1.9 2.5 Depreciation and Amortization 0.4 1.0 Salaries and Related Expenses 1.6 3.6 Total Operating Expenses $10.7 $20.4 Operating Income (Loss) ($4.3) $2.1 Other Income (Expense) Miscellaneous Income (Expense) 0.1 (0.0) Interest Income 0.1 0.1 Interest Expense (0.0) (0.0) Amortization of Debt Discount (1.0) (0.4) Total Other Income (Expense) ($0.8) ($0.3) Net Income (Loss) ($5.1) $1.9
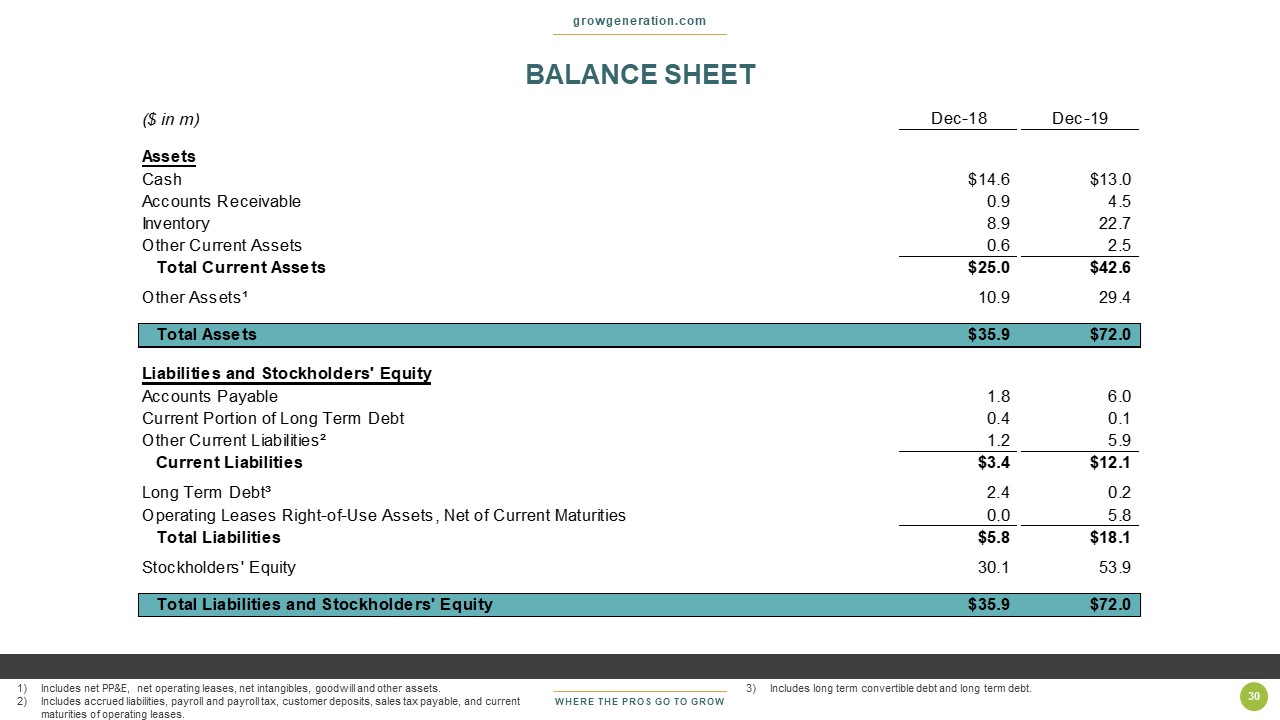
WHERE THE PROS GO TO GROW growgeneration.com 30 1) Includes net PP&E, net operating leases, net intangibles, goodwill and other assets. 2) Includes accrued liabilities, payroll and payroll tax, customer deposits, sales tax payable, and current maturities of operating leases. BALANCE SHEET ($ in m) Dec-18 Dec-19 Assets Cash $14.6 $13.0 Accounts Receivable 0.9 4.5 Inventory 8.9 22.7 Other Current Assets 0.6 2.5 Total Current Assets $25.0 $42.6 Other Assets¹ 10.9 29.4 Total Assets $35.9 $72.0 Liabilities and Stockholders' Equity Accounts Payable 1.8 6.0 Current Portion of Long Term Debt 0.4 0.1 Other Current Liabilities² 1.2 5.9 Current Liabilities $3.4 $12.1 Long Term Debt³ 2.4 0.2 Operating Leases Right-of-Use Assets, Net of Current Maturities 0.0 5.8 Total Liabilities $5.8 $18.1 Stockholders' Equity 30.1 53.9 Total Liabilities and Stockholders' Equity $35.9 $72.0 3) Includes long term convertible debt and long term debt.
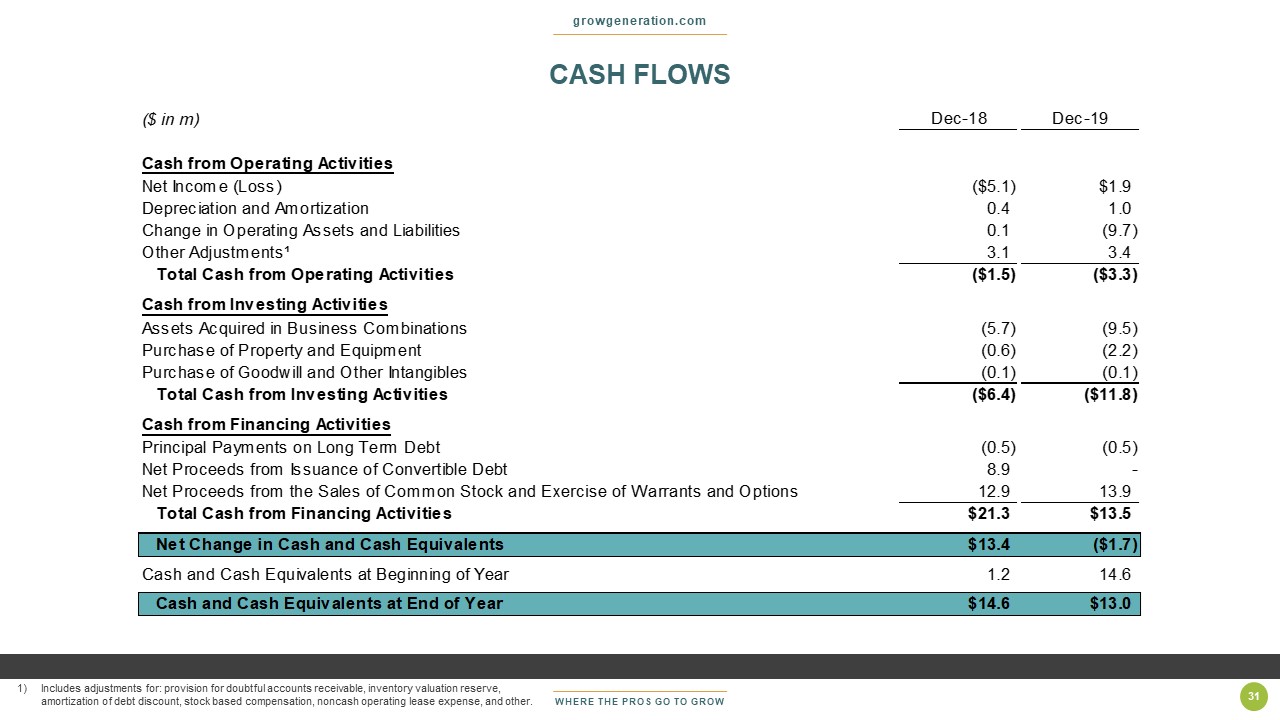
WHERE THE PROS GO TO GROW CASH FLOWS growgeneration.com 31 ($ in m) Dec-18 Dec-19 Cash from Operating Activities Net Income (Loss) ($5.1) $1.9 Depreciation and Amortization 0.4 1.0 Change in Operating Assets and Liabilities 0.1 (9.7) Other Adjustments¹ 3.1 3.4 Total Cash from Operating Activities ($1.5) ($3.3) Cash from Investing Activities Assets Acquired in Business Combinations (5.7) (9.5) Purchase of Property and Equipment (0.6) (2.2) Purchase of Goodwill and Other Intangibles (0.1) (0.1) Total Cash from Investing Activities ($6.4) ($11.8) Cash from Financing Activities Principal Payments on Long Term Debt (0.5) (0.5) Net Proceeds from Issuance of Convertible Debt 8.9 - Net Proceeds from the Sales of Common Stock and Exercise of Warrants and Options 12.9 13.9 Total Cash from Financing Activities $21.3 $13.5 Net Change in Cash and Cash Equivalents $13.4 ($1.7) Cash and Cash Equivalents at Beginning of Year 1.2 14.6 Cash and Cash Equivalents at End of Year $14.6 $13.0 1) Includes adjustments for: provision for doubtful accounts receivable, inventory valuation reserve, amortization of debt discount, stock based compensation, noncash operating lease expense, and other.
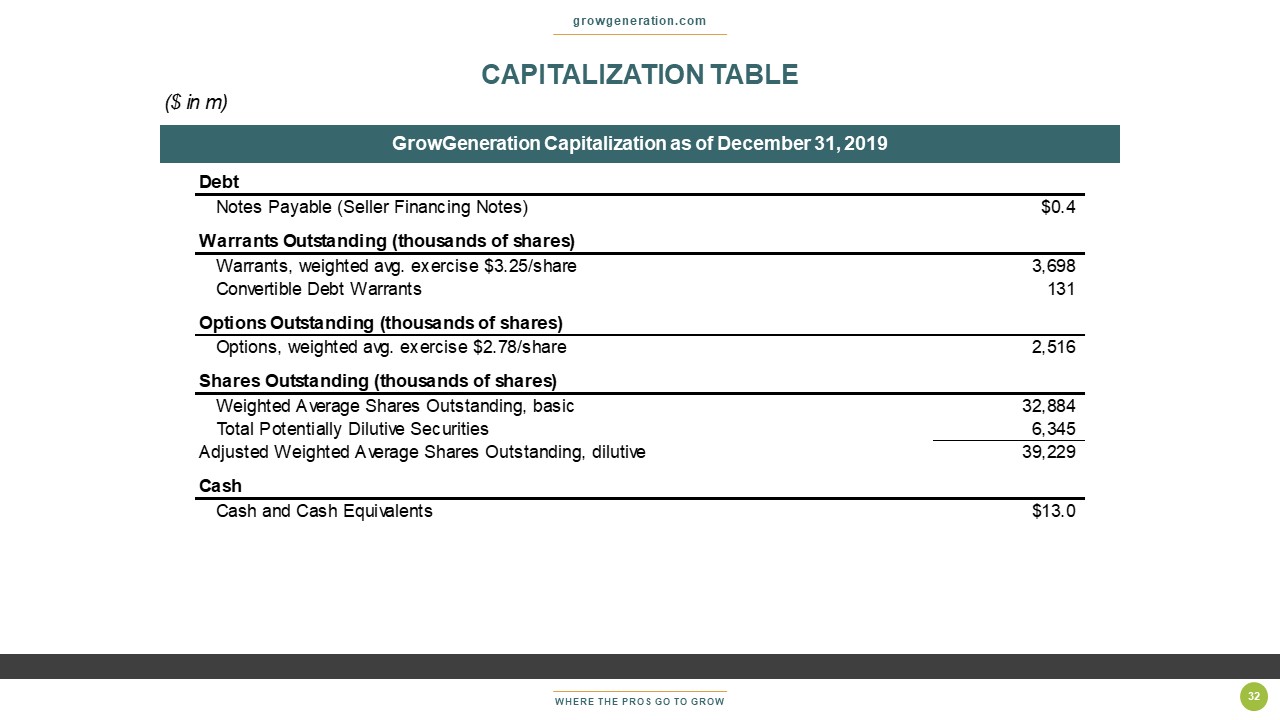
WHERE THE PROS GO TO GROW growgeneration.com 32 GrowGeneration Capitalization as of December 31, 2019 ($ in m) Dec-18 Dec-19 Sales $29.0 $79.7 Cost of Goods Sold 22.6 57.2 Gross Profit $6.4 $22.6 Operating Expenses Store Operations 5.2 10.1 General and Administrative 1.6 3.2 Share Based Compensation 1.9 2.5 Depreciation and Amortization 0.4 1.0 Salaries and Related Expenses 1.6 3.6 Total Operating Expenses $10.7 $20.4 Operating Income (Loss) ($4.3) $2.1 Other Income (Expense) Miscellaneous Income (Expense) 0.1 (0.0) Interest Income 0.1 0.1 Interest Expense (0.0) (0.0) Amortization of Debt Discount (1.0) (0.4) Total Other Income (Expense) ($0.8) ($0.3) Net Income (Loss) ($5.1) $1.9 CAPITALIZATION TABLE Debt Notes Payable (Seller Financing Notes) $0.4 Warrants Outstanding (thousands of shares) Warrants, weighted avg. exercise $3.25/share 3,698 Convertible Debt Warrants 131 Options Outstanding (thousands of shares) Options, weighted avg. exercise $2.78/share 2,516 Shares Outstanding (thousands of shares) Weighted Average Shares Outstanding, basic 32,884 Total Potentially Dilutive Securities 6,345 Adjusted Weighted Average Shares Outstanding, dilutive 39,229 Cash Cash and Cash Equivalents $13.0
WHERE THE PROS GO TO GROW COMPANY CONTACT growgeneration.com Contacts Michael Salaman President michael@growgeneration.com Darren Lampert Chief Executive Officer darren@growgeneration.com Denver, CO Tel: 800.935.8420 33