
As filed with the Securities and Exchange Commission on June 9, 2020
Registration No. 333-
UNITED STATES
SECURITIES AND EXCHANGE COMMISSION
Washington, D.C. 20549
FORM S-1
REGISTRATION STATEMENT
UNDER
THE SECURITIES ACT OF 1933
GrowGeneration Corp.
(Exact name of Registrant as specified in its charter)
| Colorado | 5200 | 46-5008129 |
| (State or other jurisdiction of | (Primary Standard Industrial | (I.R.S. Employer |
| incorporation or organization) | Classification Code Number) | Identification Number) |
930 W 7th Ave, Suite A
Denver, Colorado 80204
Telephone: 800-935-8420
(Address, including zip code, and telephone number, including area code, of Registrant’s principal executive offices)
Darren Lampert
Chief Executive Officer
GrowGeneration Corp.
930 W 7th Ave, Suite A
Denver, Colorado 80204
Telephone: 800-935-8420
(Name, address, including zip code, and telephone number,
including area code, of agent for service)
Copies to:
|
Mitchell Lampert, Esq. Robinson & Cole LLP 1055 Washington Boulevard Stamford, CT 06901 Telephone: (203) 462-7559 Fax: (203) 462-7599 |
Stuart Bressman Rupa Briggs White & Case LLP 1221 Avenue of the Americas New York, NY 10020 Telephone: (212) 819-8200 Fax: (212) 354-8113 |
Approximate date of commencement of proposed sale to the public: As soon as practicable after the effective date of this Registration Statement.
If any of the securities being registered on this Form are to be offered on a delayed or continuous basis pursuant to Rule 415 under the Securities Act of 1933, check the following box: ☐
If this Form is filed to register additional securities for an offering pursuant to Rule 462(b) under the Securities Act, please check the following box and list the Securities Act registration statement number of the earlier effective registration statement for the same offering. ☐
If this Form is a post-effective amendment filed pursuant to Rule 462(c) under the Securities Act, check the following box and list the Securities Act registration statement number of the earlier effective registration statement for the same offering. ☐
If this Form is a post-effective amendment filed pursuant to Rule 462(d) under the Securities Act, check the following box and list the Securities Act registration statement number of the earlier effective registration statement for the same offering. ☐
Indicate by check mark whether the registrant is a large accelerated filer, an accelerated filer, a non-accelerated filer, smaller reporting company, or an emerging growth company. See the definitions of “large accelerated filer,” “accelerated filer,” “smaller reporting company,” and “emerging growth company” in Rule 12b-2 of the Exchange Act.
| Large accelerated filer | ☐ | Accelerated filer | ☐ |
| Non-accelerated filer | ☒ | Smaller reporting company | ☒ |
| Emerging growth company | ☒ |
If an emerging growth company, indicate by check mark if the registrant has elected not to use the extended transition period for complying with any new or revised financial accounting standards provided pursuant to Section 7(a)(2)(B) of the Securities Act. ☐
CALCULATION OF REGISTRATION FEE
Title of Each Class of Securities to be Registered | Amount to be Registered (1) | Proposed Offering Price Per Share (2) | Proposed Maximum Aggregate Offering Price (2)(3) | Amount of Registration Fee | ||||||||||||
| Common Stock, par value $0.001 per share | - | $ | - | $ | 40,250,000 | $ | 5,224.45 | |||||||||
| (1) | Pursuant to Rule 416 under the Securities Act of 1933, as amended (the “Securities Act”). The securities being registered hereunder include such indeterminate number of additional shares of common stock as may be issued after the date hereof as a result of stock splits, stock dividends or similar transactions. |
| (2) | Estimated solely for the purpose of calculating the registration fee in accordance with Rule 457(o) of the Securities Act of 1933, as amended. |
| (3) | Includes the aggregate offering price of additional shares of common stock that the underwriters have the option to purchase, solely to cover over-allotments, if any. |
The Registrant hereby amends this Registration Statement on such date or dates as may be necessary to delay its effective date until the Registrant shall file a further amendment which specifically states that this Registration Statement shall thereafter become effective in accordance with Section 8(a) of the Securities Act of 1933, as amended, or until the Registration Statement shall become effective on such date as the Securities and Exchange Commission, acting pursuant to said Section 8(a), may determine.
The information in this prospectus is not complete and may be changed. We may not sell these securities until the registration statement filed with the Securities and Exchange Commission is effective. This prospectus is not an offer to sell these securities, and we are not soliciting offers to buy these securities, in any state where the offer or sale of these securities is not permitted.
SUBJECT TO COMPLETION, DATED JUNE 9, 2020
PRELIMINARY PROSPECTUS
$35,000,000
Common Stock
We are offering $35,000,000 of shares of our common stock. The public offering price for each share of common stock is $ .
Our common stock is listed on the Nasdaq Capital Market under the symbol “GRWG.” On June 8, 2020, the last reported sale price of our common stock on the Nasdaq Capital Market was $7.11 per share.
We are an “emerging growth company” as defined by the Jumpstart Our Business Startups Act of 2012, and as such, we have elected to comply with certain reduced public company reporting requirements for this prospectus and future filings.
Investing in our securities involves a high degree of risk. Before deciding whether to invest in our securities, please read “Risk Factors” beginning on page 7 of this prospectus, in our Annual Report on Form 10-K for the fiscal year ended December 31, 2019, as amended, and in our Quarterly Report on Form 10-Q for the quarter ended March 31, 2020.
Neither the Securities and Exchange Commission nor any state securities commission has approved or disapproved of these securities or passed upon the adequacy or accuracy of this prospectus. Any representation to the contrary is a criminal offense.
Per Share | Total | |||||||
| Public offering price | $ | $ | ||||||
| Underwriting discounts and commissions (1) | $ | $ | ||||||
| Proceeds to us, before expenses | $ | $ | ||||||
| (1) | See “Underwriting” for additional information regarding underwriting compensation. |
We have granted the underwriters an option to purchase up to an additional $5,250,000 of shares of common stock from us at the public offering price less the underwriting discounts and commissions, and on the same terms and conditions as set forth above, for 30 days after the date of this prospectus. If the underwriters exercise the option in full, the total public offering price will be $40,250,000, the total underwriting discounts and commissions will be $2,415,000, and the total proceeds, before expenses, to us will be $37,835,000.
The underwriters expect to deliver the shares against payment through the facilities of the Depository Trust Company on or about , 2020, subject to the satisfaction of customary closing conditions.
Sole Book-Running Manager
Oppenheimer & Co.
Co-Managers
| Ladenburg Thalmann | Lake Street |
The date of this prospectus is , 2020.
TABLE OF CONTENTS
i
We have not, and the underwriters have not, authorized anyone to provide you with any information or to make any representation other than that contained in this prospectus, any amendment or supplement to this prospectus or in any free writing prospectus prepared we may authorize to be delivered or made available to you. We do not, and the underwriters do not, take any responsibility for, and can provide no assurance as to the reliability of, any information that others may provide to you. We are offering to sell, and seeking offers to buy, shares of our common stock only in jurisdictions where offers and sales are permitted. The information in this prospectus is accurate only as of the date on the front cover of this prospectus, regardless of the time of delivery of this prospectus or any sale of shares of our common stock. Our business, financial condition, results of operations and prospects may have changed since that date. You should also read and consider the information in the documents to which we have referred you under the caption “Where You Can Find More Information” in this prospectus.
For investors outside the United States: Neither we nor the underwriters have done anything that would permit a public offering of the securities or possession or distribution of this prospectus in any jurisdiction where action for that purpose is required, other than in the United States. Persons outside the United States who come into possession of this prospectus must inform themselves about, and observe any restrictions relating to, the offering of the securities and the distribution of this prospectus outside of the United States.
TRADEMARKS, TRADE NAMES AND SERVICE MARKS
We use various trademarks, trade names and service marks in our business, including Blueprint Controllers, Carbide, DuraBreeze, Elemental Solutions, GrowGeneration, GrowXcess, GuardenWare, Harvester’s Edge, HeavyGardens, Ion, MixSure+, OptiLUME, Power Matrix, Smart Support, Sunleaves, Sunspot, The Fountain for Automation, VitaPlant, and Where The Pros Go To Grow. For convenience, we may not include the SM, ® or ™ symbols, but such omission is not meant to indicate that we would not protect our intellectual property rights to the fullest extent allowed by law. Any other trademarks, trade names or service marks referred to in this prospectus are the property of their respective owners.
INDUSTRY AND MARKET DATA
This prospectus includes industry data and forecasts that we obtained from industry publications and surveys, public filings and internal company sources. Industry publications, surveys and forecasts generally state that the information contained therein has been obtained from sources believed to be reliable, but there can be no assurance as to the accuracy or completeness of the included information. Statements as to our ranking, market position and market estimates are based on third-party forecasts, management’s estimates and assumptions about our markets and our internal research. We have not independently verified such third-party information, nor have we ascertained the underlying economic assumptions relied upon in those sources, and we cannot assure you of the accuracy or completeness of such information contained in this prospectus. Such data involve risks and uncertainties and is subject to change based on various factors, including those discussed under “Risk Factors” and “Cautionary Statement Regarding Forward-Looking Statements.”
ii
The following summary highlights information contained elsewhere in this prospectus and does not contain all of the information that you should consider in making your investment decision. Before investing in our securities, you should carefully read this entire prospectus, including the sections in this prospectus entitled “Risk Factors,” “Management’s Discussion and Analysis of Financial Condition and Results of Operations,” and our consolidated financial statements and the related notes included elsewhere in this prospectus, before making an investment decision.
Except as otherwise indicated herein or as the context otherwise requires, references in this prospectus to “GrowGeneration,” the “Company,” “we,” “us” and “our” refer to GrowGeneration Corp., together with our wholly-owned subsidiaries (GrowGeneration Pueblo Corp, GrowGeneration California Corp, Grow Generation Nevada Corp, GrowGeneration Washington Corp, GrowGeneration Rhode Island Corp, GrowGeneration Oklahoma Corp, GrowGeneration Canada, GrowGeneration HG Corp, GrowGeneration Hemp Corp, GGen Distribution Corp, GrowGeneration Michigan Corp, GrowGeneration New England Corp, GrowGeneration Florida Corp and GrowGeneration Management Corp.) on a consolidated basis.
Our Company
General
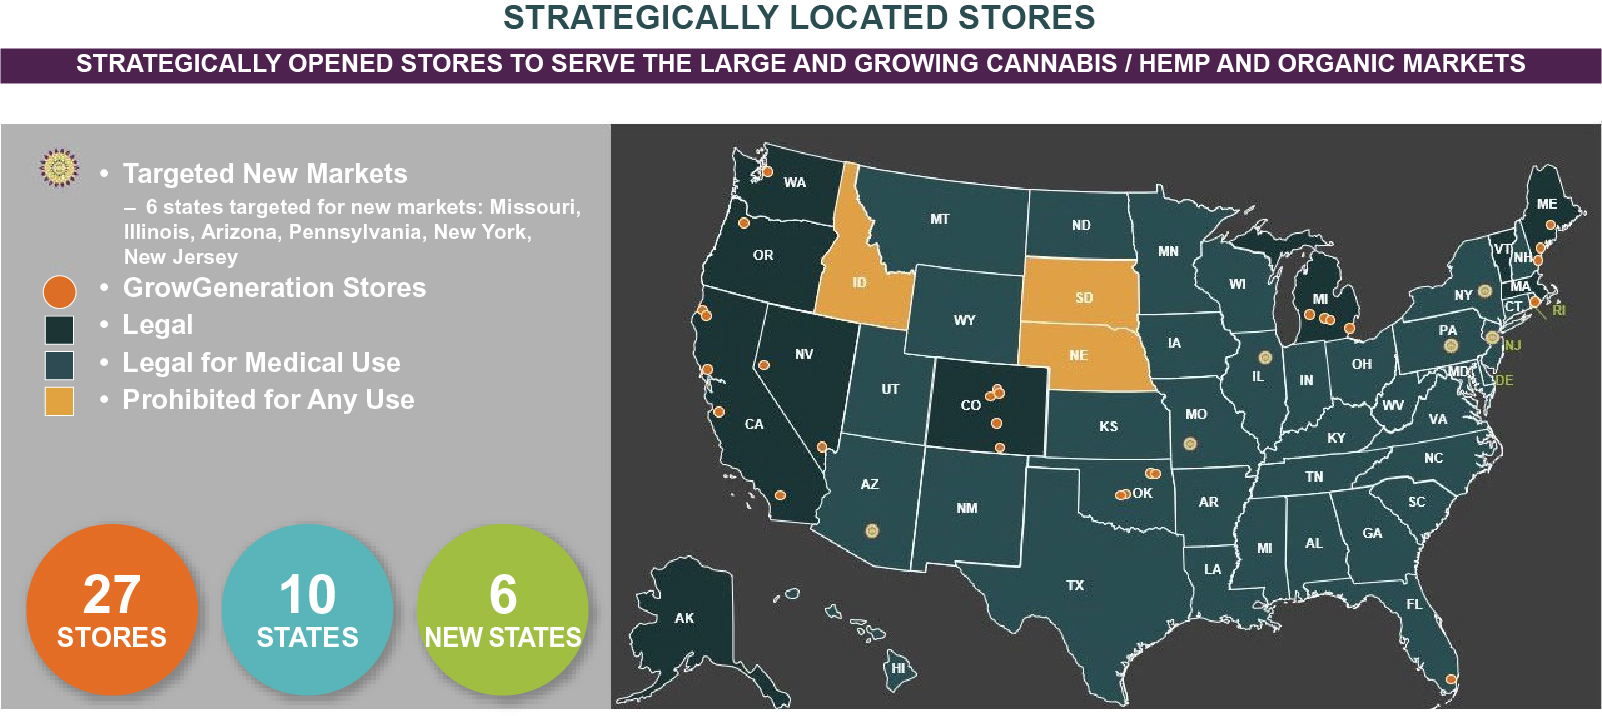
We believe we are the largest chain of stand-alone hydroponic garden centers by revenue and number of stores in the United States. We also believe we are a leading marketer and distributor of nutrients, growing media, advanced indoor and greenhouse lighting, ventilation systems and accessories for hydroponic gardening, based on management’s estimates. We have a diverse customer base, with commercial customers constituting the majority of our total sales. As of June 9, 2020, we own and operate a chain of 27 retail and commercial hydroponic/gardening centers in 10 U.S. states. We also operate an online e-commerce store, growgeneration.com. Our core strategy continues to focus on expanding our geographic reach across the United States through organic growth, in terms of increasing same store sales and expanding customer base, and acquisitions.
Our retail operations are driven by our high-quality products, value-add knowledgeable staff and fast distribution capabilities. As of June 9, 2020, we employ horticulturists that we have branded “Grow Pros”. Our operations span over 300,000 square feet of retail and warehouse space. During COVID-19, we have been deemed an “essential” supplier to the agricultural industry and, as such, we remained open and continued our operations. In the first quarter of 2020, our revenue was $33 million, which increased 152% from the same period of the prior year, and in 2019, our revenue was $80 million, which increased 175% compared to 2018.
We operate our business through the following sales channels:
| ● | Retail: 27 retail and commercial hydroponic/gardening centers focused on serving growers and cultivators. |
| ● | Commercial: Sales to commercial customers, including expert growers and cultivators, and provide them with advice from sales representatives with the requisite expertise (whom we brand as “GrowPros”) to serve their specific needs. |
| ● | E-Commerce: Our existing e-commerce operation, growgeneration.com (previously HeavyGarden.com and GrowGen.Pro), is currently being developed and rebranded into an omni-channel sales approach to enable e-commerce at all of our locations, which we intend to launch in late June 2020. |
| ● | Distribution: The majority of our stores are also functioning as warehouse, distribution and fulfillment centers for directing products to our store locations and to the retail, wholesale and mass hydroponic markets. |
Growth Strategy - Store Acquisitions and New Store Openings
Our growth strategy is to expand the number of our retail and commercial operations throughout the United States. The hydroponic retail landscape is fragmented, which we believe has allowed us to acquire the “best of breed” locations in the United States. In addition, we have a two-year roadmap to open a number of new locations in markets that we believe are underserved throughout the country. In addition to the 10 states where we are currently operating, we have identified Arizona, Illinois, Pennsylvania, New York, New Jersey and Missouri as new markets where we plan to open a new operation. In 2019, we opened and acquired ten locations and in the first quarter of 2020, we opened a second hydroponic/gardening center in Tulsa, Oklahoma, a 40,000 square feet store operation and fulfillment center, and acquired Healthy Harvest located outside of Miami, FL.
1
Commercial Sales Division
In 2019, we created a commercial division with a dedicated sales and support team to sell and service large commercial customers, who are primarily licensed growers of medicinal and non-medicinal cannabis. As of the first quarter of 2020, our commercial division services over 500 commercial accounts, who collectively contributed $17 million in revenue or approximately 20% of our sales in 2019. We have identified over 14,000 licensed hemp and cannabis growers in the United States, and believe there is significant room for us to expand our base of commercial customers.
E-Commerce Strategy
We are currently developing and rebranding our existing e-commerce operation, HeavyGarden.com and GrowGen.Pro, as growgeneration.com, which will be an omni-channel sales approach to enable e-commerce at all of our locations, providing our customers convenient ways to shop when and how they feel comfortable. We intend to launch this strategy in late June 2020. This omni-channel approach will provide 24/7 availability of products and allow our customers to “Buy Online and Pick Up In Store.” Customers will be able to shop online in all product departments and access descriptions, reviews and pictures of our products. Our customers can order online and they can choose to either have their products delivered directly to their growing facility (usually within 48 hours) or they can pick up the products at one of our stores (usually within 24 hours). We believe that this omni-channel initiative will result in a more seamless, convenient shopping experience for our customers and will drive financial results.
Distribution Channel
We have built a supply chain that currently spans through 27 locations across 10 states. We are in the process of building several 20,000 square foot store operations that will serve as fulfillment service centers, in addition to serving the local retail and commercial customers. These stores and fulfillment centers will ship directly to a farm or home as well as to any commercial hydroponic store (including ours and others) in the United States. We have a fleet of trucks that allow us to deliver within the proximity of any of these locations.
Products and Private Label Strategy
We sell a variety of products, including nutrients, growing media, advanced indoor and greenhouse lighting, ventilation systems, and accessories for hydroponic gardening, as well as other indoor and outdoor growing products. Our supply chain includes several thousand stock keeping units (“SKUs”) across 12 product departments. Many of our products are consumables leading to repeat orders by our customers. Consumable products are mainly nutrients and additives that feed the plants on a recurring basis. Our strategy is to supply products to two groups of customers: commercial growers and smaller growers that require a local center to fulfill their daily and weekly growing needs.
2
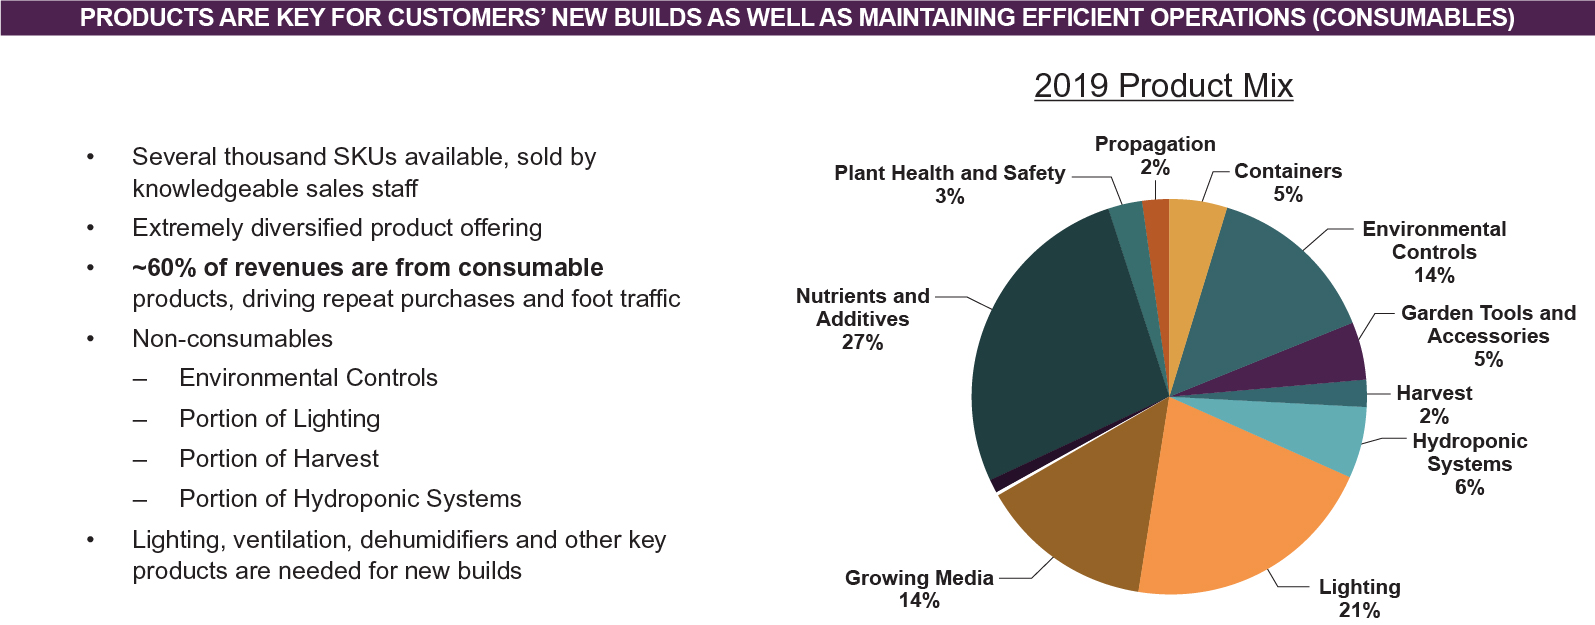
We are also actively developing a line of private label products that we intend to sell through our garden centers under brands we own or control. Our strategy is to deliver high-quality products at a lower cost, and higher margin to us. To further our private label strategy, we acquired various trademarks in March 2019 to aid in branding our ‘in house’ products to our customers. We introduced our first private labeled products under the Sunleaves brand in first quarter of 2020. This initial offering encompassed a broad variety of products ranging from trellis netting to plastic pots and organic nutrients. We intend to introduce additional private label products during 2020 and 2021. We believe that expanding our private label offerings will have a positive impact on our margins and profitability in the near term.
Markets
Our stores sell thousands of products, including nutrients, growing media, advanced indoor and greenhouse lighting, ventilation systems, and accessories for hydroponic gardening, as well as other indoor and outdoor growing products, that serve multi-purposes and are designed and intended for growing a wide range of plants. Hydroponics is a specialized method of growing plants using mineral nutrient solutions in a water solvent, as opposed to soil. This method is typically used inside greenhouses to give growers the ability to better regulate and control nutrient delivery, light, air, water, humidity, pests, and temperature. Hydroponic growers benefit from these techniques by producing crops faster and with higher crop yields per acre as compared to traditional soil-based growers. Indoor growing techniques and hydroponic products are being utilized in new and emerging industries or segments, including the growing of cannabis and hemp. In addition, vertical farms producing organic fruits and vegetables are also beginning to utilize hydroponics due to a rising shortage of farmland as well as environmental vulnerabilities including drought, other severe weather conditions and insect pests.
According to a report by Markets and Markets on the hydroponics market, the global hydroponics system market is estimated to grow from an estimated $8 billion in 2019 to approximately $16 billion by 2025, at a compound annual growth rate of approximately 12%. In the U.S. hydroponics market, the legalization of cannabis for medicinal and non-medicinal use and increased number of licensed cultivation facilities are driving demand for hydroponic products. Currently there are comprehensive, publicly available medical marijuana/cannabis programs in 33 states and the District of Columbia, including 11 states that also permit recreational sales to adults. We believe that the growth in licensed cultivation facilities and the increase in organically grown produce will increase the demand for hydroponics products generally. Further, the current landscape for retail stores focusing on selling hydroponic garden products is very fragmented and presents opportunities for consolidation.
We have a diverse customer base, with commercial customers constituting the majority of our total sales. We cater to commercial and home cultivators growing specialty crops, including growing cannabis and hemp, along with organic herbs and leafy green vegetables. We believe that commercial growers choose to source their hydroponic gardening supplies from us because we understand their specific needs and employ sales representatives with the requisite expertise (whom we brand as “GrowPros”) to serve expert growers and cultivators by helping them reduce any potential challenges in utilizing hydroponic products to grow their crops. Based on our customer profile, we believe that we are well positioned to benefit from growth of the overall hydroponic market. In addition, we believe that the highly fragmented hydroponics retail market and numerous single store operators presents us with a significant opportunity to execute our roll-up strategy to expand and deepen our geographic footprint.
Competitive Advantages
As the largest chain of stand-alone hydroponic garden centers by revenue and number of stores in the United States based on management’s estimates, we believe that we have the following core competitive advantages over our competitors:
| ● | We offer a one-stop shopping experience to all types of growers by providing “selection, service, and solutions”; |
| ● | We provide end-to-end solutions for our commercial customers from capex built-out to consumables to nourish their plants; |
| ● | We have a knowledge-based sales team, all with horticultural experience; |
| ● | We offer the options to transact online, in store, or buy online and pick up; |
| ● | We consider ourselves to be a leader of the products we offer, from launching new technologies to the development of our private label products; and |
| ● | We have a professional team for mergers and acquisitions to acquire and open new locations and successfully add them to our company portfolio. |
3
Risks Associated with Our Business
Investing in our securities involves substantial risk. The risks described under the heading “Risk Factors” beginning on page 7 of this prospectus may cause us to not realize the full benefits of our strengths or may cause us to be unable to successfully execute all or part of our strategy. Some of the more significant challenges include the following:
| ● | The COVID-19 pandemic and the efforts to mitigate its impact may have an adverse effect on our business, liquidity, results of operations, financial condition and price of our securities. |
| ● | We face intense competition that could prohibit us from developing or increasing our customer base. |
| ● | If we need additional capital to fund our operations, we may not be able to obtain sufficient capital and may be forced to limit the expansion of our operations. |
| ● | Our business depends substantially on the continuing efforts of our executive officers and our business may be severely disrupted if we lose their services. |
| ● | Certain of our products may be purchased for use in new and emerging industries or segments and/or be subject to varying, inconsistent, and rapidly changing laws, regulations, administrative practices, enforcement approaches, judicial interpretations, and consumer perceptions. |
| ● | Acquisitions, other strategic alliances and investments could result in operating difficulties, dilution, and other harmful consequences that may adversely impact our business and results of operations. |
| ● | Our ongoing investment in our new private label product line is inherently risky and could disrupt our ongoing businesses. |
| ● | If we are unable to effectively execute our e-commerce business, our reputation and operating results may be harmed. |
| ● | There are risks, including stock market volatility, inherent in owning our common stock. |
Corporate Information
We were incorporated under the laws of the State of Colorado in 2014.
Our principal executive office is located at 930 W 7th Ave, Suite A, Denver, CO 80204, and our telephone number is (800) 935-8420. Our website address is www.GrowGeneration.com. Information on our website is not incorporated by reference and is not a part of this prospectus.
On December 2, 2019, the Company was approved to commence trading its common stock on the Nasdaq Capital Market under the ticker symbol of “GRWG.” Prior to that date, the Company’s stock traded on the OTCQX Best Market since October 10, 2017, prior to which it traded on the OTCQB Market since November 11, 2016.
Implications of Being an Emerging Growth Company and Smaller Reporting Company
We are an emerging growth company, as defined in the Jumpstart Our Business Startups Act of 2012 (JOBS Act). For as long as we continue to be an emerging growth company, we may take advantage of exemptions from various reporting requirements that are applicable to other public companies that are not emerging growth companies, including not being required to comply with the auditor attestation requirements of Section 404 of the Sarbanes-Oxley Act of 2002, or the Sarbanes-Oxley Act, reduced disclosure obligations regarding executive compensation in this prospectus and our periodic reports and proxy statements and exemptions from the requirements of holding nonbinding advisory votes on executive compensation and stockholder approval of any golden parachute payments not previously approved. We could be an emerging growth company up to December 31, 2021, although circumstances could cause us to lose that status earlier, including if the market value of our common stock held by non-affiliates exceeds $700 million as of any June 30 before that time or if we have total annual gross revenue of $1.07 billion or more during any fiscal year before that time, in which cases we would no longer be an emerging growth company as of the following December 31 or, if we issue more than $1.07 billion in non-convertible debt during any three-year period before that time, we would cease to be an emerging growth company immediately. Even after we no longer qualify as an emerging growth company, we may still qualify as a “smaller reporting company” which would allow us to take advantage of many of the same exemptions from disclosure requirements, including reduced disclosure obligations regarding executive compensation in our periodic reports and proxy statements. Additionally, even if we no longer qualify as an emerging growth company, as long as we are neither a “large accelerated filer” nor an “accelerated filer,” we would not be required to comply with the auditor attestation requirements of Section 404 of the Sarbanes-Oxley Act.
We cannot predict if investors will find our securities less attractive because we may rely on these exemptions, which could result in a less active trading market for our securities and increased volatility in the price of our securities.
Finally, we are a “smaller reporting company” (and may continue to qualify as such even after we no longer qualify as an emerging growth company) and accordingly may provide less public disclosure than larger public companies, including the inclusion of only two years of audited financial statements and only two years of management’s discussion and analysis of financial condition and results of operations disclosure. As a result, the information that we provide to our stockholders may be different than you might receive from other public reporting companies in which you hold equity interests.
4
THE OFFERING
| Common stock to be offered by us | shares of our common stock ( shares if the underwriters exercise their over-allotment option in full) | |
| Public offering price | $ | |
| Common stock to be outstanding after this offering | shares (or shares if the underwriters exercise their over-allotment option in full) | |
| Underwriters’ over-allotment option | We have granted the underwriters the option to purchase up to an additional $5,250,000 of shares of our common stock, solely to cover over-allotments, if any. The underwriters can exercise this option at any time within 30 days after the date of this prospectus. | |
| Use of proceeds |
We estimate that the net proceeds from this offering will be approximately $32,150,000 million (or approximately $37,085,000 if the underwriters exercise their over-allotment option in full), after deducting the estimated underwriting discounts and commissions and estimated offering expenses payable by us.
We intend to use the net proceeds from this offering primarily to expand our network of hydroponic/garden centers through organic growth and acquisitions and general corporate purposes. See “Use of Proceeds” on page 12 of this prospectus. | |
| Risk factors | An investment in our securities involves a high degree of risk. See “Risk Factors” beginning on page 7 of this prospectus and other information included in this prospectus for a discussion of factors you should carefully consider before deciding to invest in our common stock. | |
| The Nasdaq Capital Market symbol | “GRWG” |
Except as otherwise indicated herein, the number of shares of common stock outstanding before this offering and that will be outstanding after this offering is based on 38,713,338 shares of common stock outstanding as of June 9, 2020 and excludes: (i) a total of 3,151,079 shares of our common stock issuable upon exercise of warrants; and (ii) a total of 2,334,170 shares of our common stock issuable upon exercise of options.
Unless otherwise stated or the context requires otherwise, all information in this prospectus assumes that the option to purchase up to additional shares of common stock that we have granted to the underwriters is not exercised.
5
SUMMARY CONSOLIDATED FINANCIAL DATA
The following tables set forth our summary historical consolidated financial data as of, and for the periods ended on, the dates indicated. The summary consolidated statements of operations data for the years ended December 31, 2019 and 2018 and the summary consolidated balance sheet data as of December 31, 2019 and 2018 are derived from our audited consolidated financial statements and notes that are included elsewhere in this prospectus. The summary consolidated statements of operations data for the three months ended March 31, 2020 and 2019 and the summary consolidated balance sheets data as of March 31, 2020 and 2019 are derived from our unaudited interim consolidated financial statements and notes that are included elsewhere in this prospectus. We have prepared the unaudited consolidated financial statements in accordance with generally accepted accounting principles (GAAP) and on the same basis as the audited consolidated financial statements, except for the impact of the adoption of ASU 2016-02, Leases, and have included all adjustments, consisting of only normal recurring adjustments that, in our opinion, we consider necessary for a fair statement of the consolidated financial information set forth in those statements. Our historical results are not necessarily indicative of our results in any future period and results from our interim period may not necessarily be indicative of the results of the entire year.
The following summary consolidated financial data should be read together with the information under the caption “Management’s Discussion and Analysis of Financial Condition and Results of Operations” and our consolidated financial statements and related notes appearing elsewhere in this prospectus. The summary consolidated financial data in this section are not intended to replace our consolidated financial statements and the related notes and are qualified in their entirety by the consolidated financial statements and related notes included elsewhere in this prospectus.
| For the Three Months Ended March 31, 2020 | For the Three Months Ended March 31, 2019 | For the Fiscal Year Ended December 31, 2019 | For the Fiscal Year Ended December 31, 2018 | |||||||||||||
| $ (Unaudited) | $ (Unaudited) | $ (Audited) | $ (Audited) | |||||||||||||
| Statement of operations data: | ||||||||||||||||
| Revenues | $ | 32,981,506 | $ | 13,087,222 | $ | 79,733,568 | $ | 29,000,730 | ||||||||
| Cost of sales | 24,035,257 | 9,400,591 | 57,171,721 | 22,556,172 | ||||||||||||
| Gross Profit | 8,946,249 | 3,686,631 | 22,561,847 | 6,444,558 | ||||||||||||
| Operating expenses | 11,063,232 | 3,337,120 | 20,421,726 | 10,700,206 | ||||||||||||
| Income (loss) from operations | (2,116,983 | ) | 349,511 | 2,140,121 | (4,255,648 | ) | ||||||||||
| Other expense | 23,645 | (120,090 | ) | (261,317 | ) | (818,107 | ) | |||||||||
| Net income (loss) | $ | (2,093,518 | ) | $ | 229,421 | $ | 1,878,804 | $ | (5,073,755 | ) | ||||||
| Income (loss) per share, basic | $ | (.055 | ) | $ | .01 | $ | .06 | $ | (.22 | ) | ||||||
| Income (loss) per share, diluted | $ | (.055 | ) | $ | .01 | $ | .05 | $ | (.22 | ) | ||||||
| Weighted average ordinary shares outstanding, basic | 37,823,304 | 28,437,132 | 32,833,594 | 23,492,650 | ||||||||||||
| Weighted average ordinary shares outstanding, diluted | 37,823,304 | 34,263,302 | 39,228,696 | 23,492,650 | ||||||||||||
| Balance sheet data | ||||||||||||||||
| Current assets | $ | 48,928,766 | $ | 23,619,636 | $ | 42,643,569 | $ | 24,977,884 | ||||||||
| Total assets | $ | 80,459,513 | $ | 43,705,790 | $ | 72,022,352 | $ | 35,892,974 | ||||||||
| Current liabilities | $ | 17,263,857 | $ | 6,229,786 | $ | 12,081,264 | $ | 3,414,716 | ||||||||
| Total liabilities | $ | 22,978,767 | $ | 12,120,126 | $ | 18,130,609 | $ | 5,834,455 | ||||||||
| Total equity | $ | 57,480,746 | $ | 31,585,664 | $ | 53,891,743 | $ | 30,058,519 | ||||||||
| Total liabilities and stockholder’s equity | $ | 80,459,513 | $ | 43,705,790 | $ | 72,022,352 | $ | 35,892,974 | ||||||||
6
An investment in our securities involves a high degree of risk. You should carefully consider the risks described below and all of the other information contained in this prospectus and in any free writing prospectuses prepared by or on behalf of us or to which we have referred you, including our consolidated financial statements and the related notes and “Management’s Discussion and Analysis of Financial Condition and Results of Operations” before deciding whether to invest in our securities. If any of the possible events described below actually occur, our business, business prospects, cash flow, results of operations or financial condition could be harmed. In this case, the trading price of our common stock could decline, and you might lose all or part of your investment.
The following is a discussion of the risk factors that we believe are material to us at this time. These risks and uncertainties are not the only ones facing us and there may be additional matters that we are unaware of or that we currently consider immaterial. All of these could adversely affect our business, results of operations, financial condition and cash flows.
Risks Related to Our Business
The COVID-19 pandemic and the efforts to mitigate its impact may have an adverse effect on our business, liquidity, results of operations, financial condition and price of our securities.
The pandemic involving the novel strain of coronavirus, or COVID-19, and the measures taken to combat it, may have certain an adverse effect on our business. Public health authorities and governments at local, national and international levels have announced various measures to respond to this pandemic. Some measures that directly or indirectly impact our business include:
| ● | voluntary or mandatory quarantines; |
| ● | restrictions on travel; and |
| ● | limiting gatherings of people in public places. |
Although we have been deemed an “essential” business by state and local authorities in the areas in which we operate, we have undertaken the following measures in an effort to mitigate the spread of COVID-19 including limiting store business hours, and encouraging employees to work remotely if possible. We also have enacted our business continuity plans, including implementing procedures requiring employees working remotely where possible which may make maintaining our normal level of corporate operations, quality controls and internal controls difficult. Moreover, the COVID-19 pandemic has caused temporary or long-term disruptions in our supply chains and/or delays in the delivery of our inventory. Further, the COVID-19 pandemic and mitigation efforts have also adversely affected our customers’ financial condition, resulting in reduced spending for the products we sell.
As events are rapidly changing, we do not know how long the COVID-19 pandemic and the measures that have been introduced to respond to it will disrupt our operations or the full extent of that disruption. Further, once we are able to restart normal business hours and operations doing so may take time and will involve costs and uncertainty. We also cannot predict how long the effects of COVID-19 and the efforts to contain it will continue to impact our business after the pandemic is under control. Governments could take additional restrictive measures to combat the pandemic that could further impact our business or the economy in the geographies in which we operate. It is also possible that the impact of the pandemic and response on our suppliers, customers and markets will persist for some time after governments ease their restrictions. These measures have negatively impacted, and may continue to impact, our business and financial condition as the responses to control COVID-19 continue.
Many of our suppliers are experiencing operational difficulties as a result of COVID-19, which in turn may have an adverse effect on our ability to provide products to our customers.
The measures being taken to combat the pandemic are impacting our suppliers and may destabilize our supply chain. For example, manufacturing plants have closed and work at others curtailed in many places where we source our products. Some of our suppliers have had to temporarily close a facility for disinfecting after employees tested positive for COVID-19, and others have faced staffing shortages from employees who are sick or apprehensive about coming to work. Further, the ability of our suppliers to ship their goods to us has become difficult as transportation networks and distribution facilities have had reduced capacity and have been dealing with changes in the types of goods being shipped.
Currently the difficulties experienced by our suppliers have not yet impacted our ability to products to our customers and we do not significantly depend on any one supplier; however, if this continues, it may negatively affect our inventory and delayed the delivery of merchandise to our stores and customers, which in turn will adversely affect our revenues and results of operations. If the difficulties experienced by our suppliers continue, we cannot guarantee that we will be able to locate alternative sources of supply for our merchandise on acceptable terms, or at all. If we are unable to adequately purchase appropriate amounts of inventory, our business and results of operations may be materially and adversely affected.
Economic conditions could adversely affect our business.
Uncertain global economic conditions, in particular in light of the COVID-19 pandemic, could adversely affect our business. Negative global economic trends, such as decreased consumer and business spending, high unemployment levels and declining consumer and business confidence, pose challenges to our business and could result in declining revenues, profitability and cash flow. Although we continue to devote significant resources to support our brands, unfavorable economic conditions may negatively affect demand for our products.
7
We face intense competition that could prohibit us from developing or increasing our customer base.
The specialty gardening and hydroponic product industry is highly competitive. We may compete with companies that have greater capital resources and facilities. More established gardening companies with much greater financial resources which do not currently compete with us may be able to easily adapt their existing operations to sales of hydroponic growing equipment. Our competitors may also introduce new hydroponic growing equipment, and manufacturers may sell equipment direct to consumers. Due to this competition, there is no assurance that we will not encounter difficulties in increasing revenues and maintaining and/or increasing market share. In addition, increased competition may lead to reduced prices and/or margins for products we sell.
If we need additional capital to fund the expansion of our operations, we may not be able to obtain sufficient capital on terms favorable to us and may be forced to limit the expansion of our operations.
In connection with our growth strategies, we may experience increased capital needs and accordingly, we may not have sufficient capital to fund the future expansion of our operations without additional capital investments. There can be no assurance that additional capital will be available to us on terms favorable to us. If we cannot obtain sufficient capital to fund our expansion, we may be forced to limit the scope of our acquisitions and new store openings.
Our business depends substantially on the continuing efforts of our executive officers and our business may be severely disrupted if we lose their services.
Our future success depends substantially on the continued services of our executive officers, especially our Chief Executive Officer, Darren Lampert, our President, Michael Salaman, our Chief Financial Officer, Monty Lamirato, and our Chief Operating Officer, Tony Sullivan. We do not maintain key man life insurance on any of our executive officers and directors. If one or more of our executive officers are unable or unwilling to continue in their present positions, we may not be able to replace them readily, if at all. The loss of any of our officers could cause our business to be disrupted, and we may incur additional expenses to recruit and retain new officers.
Litigation may adversely affect our business, financial condition and results of operations.
From time to time in the normal course of our business operations, we may become subject to litigation that may result in liability material to our financial statements as a whole or may negatively affect our operating results if changes to our business operation are required. The cost to defend such litigation may be significant and may require a diversion of our resources. There also may be adverse publicity associated with litigation that could negatively affect customer perception of our business, regardless of whether the allegations are valid or whether we are ultimately found liable. As a result, litigation may adversely affect our business, financial condition and results of operations. Since inception, the Company has not been a party to any material litigation.
Certain of our products may be purchased for use in new and emerging industries or segments and/or be subject to varying, inconsistent, and rapidly changing laws, regulations, administrative practices, enforcement approaches, judicial interpretations, and consumer perceptions.
We sell hydroponic gardening products that end users may purchase for use in new and emerging industries or segments, including the growing of cannabis, that may not grow or achieve market acceptance in a manner that we can predict. The demand for these products depends on the uncertain growth of these industries or segments.
In addition, we sell products that end users may purchase for use in industries or segments, including the growing of cannabis, that are subject to varying, inconsistent, and rapidly changing laws, regulations, administrative practices, enforcement approaches, judicial interpretations, and consumer perceptions. For example, certain countries and 33 U.S. states have adopted frameworks that authorize, regulate, and tax the cultivation, processing, sale, and use of cannabis for medicinal and/or non-medicinal use, while the U.S. Controlled Substances Act and the laws of other U.S. states prohibit growing cannabis.
Our hydroponic gardening products are multi-purpose products designed and intended for growing a wide range of plants and are generally purchased from retailers by end users who may grow any variety of plants, including cannabis. Although the demand for our products may be negatively impacted depending on how laws, regulations, administrative practices, enforcement approaches, judicial interpretations, and consumer perceptions develop, we cannot reasonably predict the nature of such developments or the effect, if any, that such developments could have on our business.
Acquisitions, other strategic alliances and investments could result in operating difficulties, dilution, and other harmful consequences that may adversely impact our business and results of operations.
Acquisitions are an important element of our overall corporate strategy and use of capital, and these transactions could be material to our financial condition and results of operations. We expect to continue to evaluate and enter into discussions regarding a wide array of potential acquisitions and strategic transactions. The areas where we may face risks in connection with acquisitions include, but are not limited to, the failure to successfully further develop the acquired business, the implementation or remediation of controls, procedures and policies at the acquired business, the transition of operations, users and customers onto our existing platforms, and cultural challenges associated with integrating employees from the acquired business into our organization, and retention of employees from the businesses we acquire. Our failure to address these risks or other problems encountered in connection with our acquisitions could cause us to fail to realize the anticipated benefits of such acquisitions, investments or alliances, incur unanticipated liabilities, and harm our business generally.
8
Our acquisitions could also result in dilutive issuances of our equity securities, the incurrence of debt, contingent liabilities or amortization expenses, or impairment of goodwill and purchased long-lived assets, and restructuring charges, any of which could harm our financial condition or results of operations and cash flows. Also, the anticipated benefits and synergies of many of our acquisitions may not materialize.
Our ongoing investment in our new private label product line is inherently risky and could disrupt our ongoing businesses.
We have invested and expect to continue to invest in our new private label product line. Such endeavors may involve significant risks and uncertainties, including insufficient revenues to offset liabilities assumed and expenses associated with this new investment, inadequate return of capital on our investment, and unidentified issues not discovered in our assessment of such strategy and offerings. Because this new venture is inherently risky, no assurance can be given that such strategy and offerings will be successful and will not adversely affect our reputation, financial condition, and operating results.
If we are unable to effectively execute our e-commerce business, our reputation and operating results may be harmed.
We sell certain of our products over the Internet through our online store, which represents a small but growing percentage of our overall net sales. The success of our e-commerce business depends on our investment in this platform, consumer preferences and buying trends relating to e-commerce, and our ability to both maintain the continuous operation of our online store and our fulfillment operations and provide a shopping experience that will generate orders and return visits to our online store.
We are also vulnerable to certain additional risks and uncertainties associated with our e-commerce business, including: changes in required technology interfaces; website downtime and other technical failures; costs and technical issues associated with website software, systems and technology investments and upgrades; data and system security; system failures, disruptions and breaches and the costs to address and remedy such failures, disruptions or breaches; computer viruses; and changes in and compliance with applicable federal and state regulations. In addition, our efforts to remain competitive with technology trends, including the use of new or improved technology, creative user interfaces and other e-commerce marketing tools such as paid search and mobile applications, among others, may increase our costs and may not increase sales or attract consumers. Our failure to successfully respond to these risks and uncertainties might adversely affect the sales of our e-commerce business, as well as damage our reputation and brands.
In addition, the success of our e-commerce business and the satisfaction of our consumers depend on their timely receipt of our products or to be able to pick up their desired products from one of our garden centers. The efficient delivery and/or pick up of our products requires that our garden and distribution centers have adequate capacity to support the current level of e-commerce operations and any anticipated increased levels that may occur as a result of the growth of our e-commerce business. If we encounter difficulties with our garden and distribution centers, or if any garden and distribution centers shut down for any reason, including as a result of fire or other natural disaster or pursuant to expanded stay-at-home orders or other restrictions due to the current COVID-19 pandemic, we could face shortages of inventory, resulting in out of stock conditions in our online store, and we could incur significantly higher costs and longer lead times associated with distributing our products to our consumers and experience dissatisfaction from our consumers. Any of these issues could have a material adverse effect on our business and harm our reputation.
Our reliance on a limited base of suppliers on certain of our products may result in disruptions to our supply chain and business and adversely affect our financial results.
We rely on a limited number of suppliers for certain of our hydroponic products and other supplies. If we are unable to maintain supplier arrangements and relationships, if we are unable to contract with suppliers at the quantity and quality levels needed for our business, if any of our key suppliers becomes insolvent or experience other financial distress or if any of our key suppliers is negatively impacted by COVID-19, including with respect to staffing and shipping of products, we could experience disruptions in our supply chain, which could have a material adverse effect on our financial condition, results of operations and cash flows.
9
Our operations may be impaired if our information technology systems fail to perform adequately or if we are the subject of a data breach or cyber-attack.
We rely on information technology systems in order to conduct business, including communicating with employees and our key commercial customers, ordering and managing materials from suppliers, shipping products to customers and analyzing and reporting results of operations. While we have taken steps to ensure the security of our information technology systems, our systems may nevertheless be vulnerable to computer viruses, security breaches and other disruptions from unauthorized users. If our information technology systems are damaged or cease to function properly for an extended period of time, whether as a result of a significant cyber incident or otherwise, our ability to communicate internally as well as with our retail customers could be significantly impaired, which may adversely impact our business.
Additionally, in the normal course of our business, we collect, store and transmit proprietary and confidential information regarding our customers, employees, suppliers and others, including personally identifiable information. An operational failure or breach of security from increasingly sophisticated cyber threats could lead to loss, misuse or unauthorized disclosure of this information about our employees or customers, which may result in regulatory or other legal proceedings, and have a material adverse effect on our business and reputation. We also may not have the resources or technical sophistication to anticipate or prevent rapidly-evolving types of cyber-attacks. Any such attacks or precautionary measures taken to prevent anticipated attacks may result in increasing costs, including costs for additional technologies, training and third party consultants. The losses incurred from a breach of data security and operational failures as well as the precautionary measures required to address this evolving risk may adversely impact our financial condition, results of operations and cash flows.
We have identified a material weakness in our internal control over financial reporting and may experience material weaknesses in the future or otherwise fail to maintain an effective system of internal controls in the future, as a result of which, we may not be able to accurately report our financial condition or results of operations which may adversely affect investor confidence in us and, as a result, the value of our common stock.
Effective internal controls over financial reporting are necessary for us to provide reliable financial reports. If we cannot maintain effective controls and reliable financial reports, our business and operating results could be harmed. Our management has conducted an evaluation of the effectiveness of our internal control over financial reporting as of March 31, 2020, and concluded that our internal control over financial reporting were not effective as of March 31, 2020 due to a material weakness relating to proper accounting and valuation of equity instruments recorded within share-based compensation expense. Management has evaluated remediation plans for the deficiency and has implemented changes to address the material weakness identified, including engaging an independent third party consultant to review all documents and schedules related to equity and share-based compensation prepared by the Chief Financial Officer, as well as other high-level accounting treatment, tax accrual and purchase price allocation.
We cannot assure you that there will not be material weaknesses or significant deficiencies in our internal control over financial reporting in the future. Any failure to maintain internal control over financial reporting could severely inhibit our ability to accurately report our financial condition or results of operations. The effectiveness of our controls and procedures may be limited by a variety of factors, including:
| ● | Faulty human judgment and simple errors, omissions or mistakes; | |
| ● | Fraudulent action of an individual or collusion of two or more people; | |
| ● | Inappropriate management override of procedures; and | |
| ● | The possibility that any enhancements to controls and procedures may still not be adequate to assure timely and accurate financial control. |
Our management and independent registered public accounting firm did not perform an evaluation of our internal control over financial reporting during any period in accordance with the provisions of Sarbanes-Oxley Act. Had we performed an evaluation and had our independent registered public accounting firm performed an audit of our internal control over financial reporting in accordance with the provisions of Sarbanes-Oxley Act, additional control deficiencies amounting to material weaknesses may have been identified. If we fail to remedy any material weakness, our financial statements may be inaccurate, our access to the capital markets may be restricted and the trading price of our common stock may suffer.
The COVID-19 pandemic may have the effect of heightening many of the other risks described in this ’‘Risk Factors’’ section.
To the extent the COVID-19 pandemic may adversely affect our business and financial results, it may also have the effect of heightening many of the other risks described in this ’‘Risk Factors’’ section, or other risks which we may not be currently aware of.
10
Risks Related to Our Common Stock
There are risks, including stock market volatility, inherent in owning our common stock.
The market price and volume of our common stock have been, and may continue to be, subject to significant fluctuations. These fluctuations may arise from general stock market conditions, the impact of risk factors described herein on our results of operations and financial position, or a change in opinion in the market regarding our business prospects or other factors, many of which may be outside our immediate control.
The shares of our common stock may experience substantial dilution by exercises of outstanding warrants and options.
As of June 9, 2020, we had a total of 3,151,079 shares of our common stock issuable upon exercise of warrants, and a total of 2,334,170 shares of our common stock issuable upon exercise of options. The exercise of such outstanding options and warrants will result in substantial dilution of your investment. In addition, our shareholders may experience additional dilution if we issue common stock in the future. Any of such dilution may have adverse effect on the price of our common stock.
We are an emerging growth company and a smaller reporting company within the meaning of the Securities Act, and if we take advantage of certain exemptions from disclosure requirements available to “emerging growth companies” or “smaller reporting companies,” this could make our securities less attractive to investors and may make it more difficult to compare our performance with other public companies.
We are an “emerging growth company,” as defined in the Jumpstart Our Business Startups Act of 2012, or JOBS Act, and, for as long as we continue to be an “emerging growth company,” we intend to take advantage of certain exemptions from various reporting requirements applicable to other public companies but not to “emerging growth companies,” including, but not limited to, not being required to comply with the auditor attestation requirements of Section 404 of the Sarbanes-Oxley Act, reduced disclosure obligations regarding executive compensation in our periodic reports and proxy statements, and exemptions from the requirements of holding a nonbinding advisory vote on executive compensation and stockholder approval of any golden parachute payments not previously approved. We could be an “emerging growth company” for up to five years, or until the earliest of (i) the last day of the first fiscal year in which our annual gross revenues exceed $1 billion, (ii) the date that we become a “large accelerated filer” as defined in Rule 12b-2 under the Exchange Act, which would occur if the market value of our common stock that is held by non-affiliates exceeds $700 million as of the last business day of our most recently completed second fiscal quarter, or (iii) the date on which we have issued more than $1 billion in non-convertible debt during the preceding three year period.
For as long as we remain an “emerging growth company” as defined in the JOBS Act, we intend to take advantage of certain exemptions from various reporting requirements that are applicable to other public companies that are not “emerging growth companies.”
Additionally, we are a “smaller reporting company” as defined in Item 10(f)(1) of Regulation S-K. Smaller reporting companies may take advantage of certain reduced disclosure obligations, including, among other things, providing only two years of audited financial statements. We will remain a smaller reporting company until the last day of the fiscal year in which (1) the market value of our ordinary shares held by non-affiliates exceeds $250 million as of the prior June 30, or (2) our annual revenues exceeded $100 million during such completed fiscal year and the market value of our ordinary shares held by non-affiliates exceeds $700 million as of the prior June 30. To the extent we take advantage of such reduced disclosure obligations, it may also make comparison of our financial statements with other public companies difficult or impossible.
After we are no longer an “emerging growth company,” we expect to incur additional management time and cost to comply with the more stringent reporting requirements applicable to companies that are deemed accelerated filers or large accelerated filers, including complying with the auditor attestation requirements of Section 404 of the Sarbanes-Oxley Act.
We cannot predict or estimate the amount of additional costs we may incur or the timing of such costs.
Risks Related to This Offering
If you purchase our securities in this offering, you may incur immediate and substantial dilution in the book value of your shares. You will experience further dilution if we issue additional equity or equity-linked securities in the future.
The public offering price per share of our common stock may be substantially higher than the net tangible book value per share of our common stock immediately prior to the offering. After giving effect to the sale of $35,000,000 of shares of our common stock in this offering, at the assumed public offering price of $7.11 per share, which is the last reported sale price of our common stock on the Nasdaq Capital Market on June 8, 2020, and after deducting the estimated underwriting discounts and commissions and estimated offering expenses payable by us, purchasers of our common stock in this offering will incur immediate dilution of $5.52 per share in the net tangible book value of the common stock they acquire. For a further description of the dilution that investors in this offering may experience, see “Dilution.”
If we issue additional shares of common stock (including pursuant to the exercise of outstanding stock options or warrants), or securities convertible into or exchangeable or exercisable for shares of common stock, our stockholders, including investors who purchase shares of common stock in this offering, will experience additional dilution, and any such issuances may result in downward pressure on the price of our common stock. We also cannot assure you that we will be able to sell shares or other securities in any other offering at a price per share that is equal to or greater than the price per share paid by investors in this offering, and investors purchasing shares or other securities in the future could have rights superior to existing stockholders.
11
We have broad discretion in the use of the net proceeds we receive from this offering.
Our management will have broad discretion in the application of the net proceeds we receive in this offering, including for any of the purposes described in the section entitled “Use of Proceeds,” and you will not have the opportunity as part of your investment decision to assess whether our management is using the net proceeds appropriately. Because of the number and variability of factors that will determine our use of our net proceeds from this offering, their ultimate use may vary substantially from their currently intended use. Pending their use, we may invest our net proceeds from this offering in short-term, investment-grade, interest-bearing securities. These investments may not yield a favorable return to our stockholders.
CAUTIONARY NOTE REGARDING FORWARD-LOOKING STATEMENTS
This prospectus contains “forward-looking statements,” which include information relating to future events, future financial performance, financial projections, strategies, expectations, competitive environment and regulation. Words such as “may,” “should,” “could,” “would,” “predicts,” “potential,” “continue,” “expects,” “anticipates,” “future,” “intends,” “plans,” “believes,” “estimates,” and similar expressions, as well as statements in future tense, identify forward-looking statements. Forward-looking statements should not be read as a guarantee of future performance or results and may not be accurate indications of when such performance or results will be achieved. Forward-looking statements are based on information we have when those statements are made or management’s good faith belief as of that time with respect to future events, and are subject to risks and uncertainties that could cause actual performance or results to differ materially from those expressed in or suggested by the forward-looking statements. Important factors that could cause such differences include, but are not limited to:
| ● | our current and future capital requirements to support our efforts to open or acquire new retail locations; | |
| ● | our dependence on consumer interest in growing crops with the equipment, soil and nutrients that we offer; | |
| ● | our dependence on third-parties to manufacture and sell us inventory; | |
| ● | our ability to maintain or protect the validity of our intellectual property; | |
| ● | our ability to retain key executive members; | |
| ● | our ability to internally develop products under existing intellectual property; | |
| ● | interpretations of current laws and the passage of future laws; | |
| ● | the accuracy of our estimates regarding expenses and capital requirements; and | |
| ● | our ability to adequately support growth. |
Moreover, new risks regularly emerge and it is not possible for our management to predict or articulate all risks we face, nor can we assess the impact of all risks on our business or the extent to which any risk, or combination of risks, may cause actual results to differ from those contained in any forward-looking statements. All forward-looking statements included in this prospectus are based on information available to us on the date of this prospectus. Except to the extent required by applicable laws or rules, we undertake no obligation to publicly update or revise any forward-looking statement, whether as a result of new information, future events or otherwise. All subsequent written and oral forward-looking statements attributable to us or persons acting on our behalf are expressly qualified in their entirety by the cautionary statements contained above and throughout this prospectus.
We estimate that the net proceeds to us from this offering will be approximately $32,150,000 million, after deducting the estimated underwriting discounts and commissions and estimated offering expenses payable by us. If the underwriters exercise their option to purchase additional shares in full, we estimate that our net proceeds will be approximately $37,085,000, after deducting the estimated underwriting discounts and commissions and estimated offering expenses payable by us.
We intend to use the net proceeds from this offering primarily to expand our network of hydroponic/garden centers through organic growth and acquisitions, and for general corporate purposes. The timing and amount of our actual expenditures will be based on many factors, including cash flows from operations and the anticipated growth of our business. We have not yet determined the amount of net proceeds to be used specifically for any particular purpose or the timing of these expenditures. Accordingly, our management will have significant discretion and flexibility in applying the net proceeds from the sale of these securities. Pending their use, we intend to invest the net proceeds to us from this offering in short-term, investment-grade, interest-bearing instruments.
We believe that the net proceeds from this offering, together with our existing cash, cash equivalents and investments, will enable us to fund our operations, acquisitions and new store openings through at least the next 12 months. We have based this estimate on assumptions that may prove to be wrong, and we could use our available capital resources sooner than we expect.
We have never declared or paid cash dividends on our capital stock. We currently intend to retain all available funds and any future earnings, if any, to fund the development and expansion of our business and we do not anticipate paying any cash dividends in the foreseeable future. Any future determination related to dividend policy will be made at the discretion of our Board of Directors and will depend upon, among other factors, our results of operations, financial condition, capital requirements, tax considerations, legal or contractual restrictions, business prospects, the requirements of current or then-existing debt instruments, general economic conditions and other factors our Board of Directors may deem relevant.
12
The following table sets forth our cash, cash equivalents and investments and our capitalization as of March 31, 2020:
| ● | on an actual basis; and |
| ● | on an as adjusted basis to give effect to the sale of $35,000,000 of shares of common stock in this offering at the assumed public offering price of $7.11 per share, which is the last reported sale price of our common stock on the Nasdaq Capital Market on June 8, 2020, and after deducting the estimated underwriting discounts and commissions and estimated offering expenses payable by us. |
The as adjusted information below is illustrative only and our capitalization following the completion of this offering is subject to adjustment based on the actual public offering price of our common stock and other terms of this offering determined at pricing.
You should read this table together with “Management’s Discussion and Analysis of Financial Condition and Results of Operations,” “Description of Capital Stock” and our consolidated financial statements and related notes included elsewhere in this prospectus.
| As of March 31, 2020 | ||||||||
| Actual | As Adjusted | |||||||
| (in thousands, except share data) | ||||||||
| Cash, cash equivalents and investments | $ | 11,441,225 | $ | 42,941,225 | ||||
| Long term liabilities, less current portion | $ | 230,820 | $ | 230,820 | ||||
| Stockholders’ equity | 57,480,746 | 88,980,746 | ||||||
| Common stock, par value $0.001 per share; 100,000,000 authorized shares, 38,209,300 shares issued and outstanding, actual; 100,000,000 authorized shares; 43,131,944 shares issued and outstanding, as adjusted | 38,209 | 43,132 | ||||||
| Additional paid-in capital | 66,423,243 | 97,918,320 | ||||||
| Accumulated deficit | (8,980,706 | ) | (8,980,706 | ) | ||||
| Total stockholders’ equity | $ | 57,480,746 | $ | 88,980,746 | ||||
| Total capitalization | $ | 57,711,566 | $ | 89,211,566 | ||||
If the underwriters exercise their over-allotment option in full, as adjusted cash, cash equivalents and investments, additional paid-in capital, total stockholders’ equity, total capitalization and shares of common stock outstanding as of March 31, 2020 would be $47.7 million, $102.6 million, $93.7 million, $93.9 million and 47,666,225 shares, respectively.
Except as otherwise indicated herein, the number of shares of our common stock to be outstanding after this offering is based on 38,209,300 shares of common stock outstanding as of March 31, 2020 and excludes: (i) a total of 3,368,951 shares of our common stock issuable upon exercise of warrants; and (ii) a total of 2,109,170 shares of our common stock issuable upon exercise of options.
13
If you invest in this offering, your ownership interest will be diluted to the extent of the difference between the public offering price per share of our common stock and the as adjusted net tangible book value per share of our common stock immediately after the closing of this offering.
Our net tangible book value as of March 31, 2020 was approximately $37.3 million, or $0.98 per share. Net tangible book value per share is determined by dividing our total tangible assets, less total liabilities, by the number of shares of our common stock outstanding as of March 31, 2020. Dilution with respect to net tangible book value per share represents the difference between the amount per share paid by purchasers of shares of common stock in this offering and the net tangible book value per share of our common stock immediately after this offering.
After giving effect to the sale of $35,000,000 of shares of our common stock in this offering at the assumed offering price of $7.11 per share, the last reported sale price of our common stock on the Nasdaq Capital Market on June 8, 2020, and after deducting the estimated underwriting discounts and commissions and estimated offering expenses payable by us, and assuming no exercise of the underwriters’ over-allotment option in full, our as adjusted net tangible book value as of March 31, 2020 would have been approximately $68.8 million, or $1.59 per share. This represents an immediate increase in net tangible book value of $0.61 per share to existing stockholders. Investors purchasing our common stock in this offering will have paid $5.52 more than the as adjusted net tangible book value per share after this offering. The following table illustrates this on a per share basis:
| Assumed public offering price per share | $ | 7.11 | ||||||
| Net tangible book value per share as of March 31, 2020 | $ | 0.98 | ||||||
| Increase per share attributable to new investors | $ | 0.61 | ||||||
| As adjusted net tangible book value per share after this offering | $ | 1.59 | ||||||
| As adjusted net tangible book value per share to investors purchasing shares in this offering | $ | 1.59 | ||||||
| Dilution in net tangible book value per share to new investors | $ | 5.52 | ||||||
| Dilution as a percentage of purchase price in the offering | 78 | % |
Each $1.00 increase (decrease) in the assumed public offering price of $7.11 per share, which is the last reported sale price of our common stock on the Nasdaq Capital Market on June 8, 2020, would increase (decrease) the as adjusted net tangible book value per share after this offering by approximately $0.02, and dilution in as adjusted net tangible book value per share to new investors by approximately $0.02 after deducting the estimated underwriting discounts and commissions and the estimated offering expenses payable by us, and assuming no exercise of the underwriters’ over-allotment option in full.
If the underwriters exercise their over-allotment option in full in this offering, the as adjusted net tangible book value after the offering would be $1.68 per share, the increase in as adjusted net tangible book value per share to existing stockholders would be $0.70 per share and the dilution per share to new investors would be $5.43 per share, in each case assuming a public offering price of $7.11 per share.
Except as otherwise indicated herein, the number of shares of our common stock to be outstanding after this offering is based on 38,209,300 shares of common stock outstanding as of March 31, 2020 and excludes: (i) a total of 3,368,951 shares of our common stock issuable upon exercise of warrants; and (ii) a total of 2,109,170 shares of our common stock issuable upon exercise of options.
To the extent that any outstanding options or warrants are exercised, new options, warrants or restricted stock units are issued under our stock-based compensation plans, or new shares of preferred stock are issued, or we issue additional shares of common stock in the future, there will be further dilution to investors participating in this offering.
14
MANAGEMENT’S DISCUSSION AND ANALYSIS OF
FINANCIAL CONDITION AND RESULTS OF OPERATIONS
The following discussion of our financial condition and results of operations should be read together with our financial statements and related notes included elsewhere in this prospectus. This discussion contains forward-looking statements based upon our current plans, estimates, beliefs and expectations that involve risks, uncertainties and assumptions. Our actual results may differ materially from those anticipated in these forward-looking statements as a result of various factors, including those set forth under the sections entitled “Risk Factors,” “Cautionary Note Regarding Forward-Looking Statements” and elsewhere in this prospectus.
OVERVIEW
We believe we are the largest chain of stand-alone hydroponic garden centers by revenue and number of stores in the United States. We also believe we are a leading marketer and distributor of nutrients, growing media, advanced indoor and greenhouse lighting, ventilation systems and accessories for hydroponic gardening, based on management’s estimates. We have a diverse customer base, with commercial customers constituting the majority of our total sales. As of June 9, 2020, we own and operate a chain of 27 retail and commercial hydroponic/gardening centers in 10 U.S. states. We also operate an online e-commerce store, growgeneration.com. Our core strategy continues to focus on expanding our geographic reach across the United States through organic growth, in terms of increasing same store sales and expanding customer base, and acquisitions.
Today, our commercial division services over 500 commercial accounts. Based on our results in Oklahoma, we opened our fourth location in Tulsa, OK, a 40,000 square feet super garden center. We are also actively acquiring and developing a line of private label products, which would be sold through our garden centers under brands owned or controlled by us. In this regard, we acquired a variety of trademarks in March 2019 to bolster our ability to supply branded “house” products to our customers. We started to introduce our first private-label products under the Sunleaves Garden Product brand both in our garden centers and through our e-commerce website in the fourth quarter of 2019. Our initial private label lineup includes a one-part micro and macro nutrient+ Cal mag powder line, for both cannabis and hemp farmers, a silica+ micronutrient booster and a root stimulant. All of these products are additives that can be used with any nutrient regimen. We are also planning to introduce a wider line of private label products, including rope ratchets for hoisting lighting, breathable fabric pots and T5 florescent lights for indoor gardens that will be launched in the second quarter of 2020.
Trends and Other Factors Impacting Our Performance
Acquisitions
We are an acquisitive company. Since 2014, we have acquired 24 stores and opened 15 new stores. We plan to continue to pursue acquisitions going forward. We actively evaluate and pursue acquisitions on an ongoing basis, and are focusing on Arizona, Illinois, Pennsylvania, New York, New Jersey and Missouri as new markets where we plan to open new operations.
The following table summarizes the stores we acquired, opened and consolidated since 2014:
| 2014 | 2015 | 2016 | 2017 | 2018 | 2019 | 3/31/2020 | ||||||||||||||||||||||
| Distribution center | 1 | |||||||||||||||||||||||||||
| Stores acquired | 4 | 2 | 2 | 8 | 7 | 1 | ||||||||||||||||||||||
| Stores opened | 2 | 4 | 4 | 1 | 3 | 1 | ||||||||||||||||||||||
| Stores closed/consolidated | (5 | ) | (6 | ) | (2 | ) | ||||||||||||||||||||||
| Net store added | 4 | 4 | 4 | 1 | 3 | 9 | 2 | |||||||||||||||||||||
| Cumulative Stores | 4 | 8 | 12 | 13 | 16 | 25 | 27 | |||||||||||||||||||||
We have a strong acquisition track record within the hydroponic garden center space and believe we have developed a reputation for treating sellers and their staff in a fair manner. We believe our reputation and scale have positioned us as a buyer of choice for hydroponic garden centers operators who want to sell their businesses. Our strategy is to acquire stores at attractive EBITDA multiples and then grow same-store sales while benefitting from cost-reducing synergies.
15
Regulatory Environment
We sell hydroponic gardening products to end users that may use such products in new and emerging industries or segments, including the growing of cannabis. The demand for hydroponic gardening products depends on the uncertain growth of these industries or segments due to varying, inconsistent, and rapidly changing laws, regulations, administrative practices, enforcement approaches, judicial interpretations, and consumer perceptions. For example, certain countries and 33 U.S. states have adopted frameworks that authorize, regulate, and tax the cultivation, processing, sale, and use of cannabis for medicinal and/or non-medicinal use, while the U.S. Controlled Substances Act and the laws of other U.S. states prohibit growing cannabis. Demand for our products could be impacted by changes in the regulatory environment with respect to such industries and segments.
How We Evaluate Our Operations
Sales
We earn our sales primarily from the sale of hydroponic garden products, including nutrients, growing media, advanced indoor and greenhouse lighting, ventilation systems, and accessories for hydroponic gardening, as well as other indoor and outdoor growing products. Revenue on product sales is recognized upon delivery or shipment. Customer deposits and lay away sales are not reported as revenue until final payment is received and the merchandise has been delivery.
Our sales depend on the type of products we sell and the mix between consumables and non-consumables. Due to their nature, purchases of consumables results in repeat orders as customers seek to replenish their supplies. In 2019, approximately 60% of our sales were consumables. Generally, in markets where legalization is recent and licensors are ramping up their grow operations, there are more purchases of non-consumables for build-outs compared to purchases of consumables. In more mature markets, there are generally more purchases of consumables than non-consumables. Our sales are also impacted by our customer mix of commercial and non-commercial customers, as larger commercial customers may receive volume discounts. More than a majority of our sales is derived from our commercial customers.
Gross Profit
We calculate gross profit as sales less cost of goods sold. Cost of goods sold consists of cost of product sold and freight. Gross profit excludes depreciation and amortization, which is presented separately in our consolidated statements of operations.
Gross Profit Margin
Our overall gross profit margin varies with our product mix, in particular the percentage of sales of consumable products versus non-consumables, such as in connection with build-outs, during a particular quarter. In addition, our customer mix impacts gross profit margin due to larger commercial customers receiving discounts.
Operating Expenses
Operating expenses are comprised of store operations, primarily payroll, rent and utilities, and corporate overhead. Corporate overhead is comprised of share-based compensation, depreciation and amortization, general and administrative costs and corporate salaries and related expenses. General and administrative expenses (“G&A”) consist mainly of advertising and promotions, travel & entertainment, professional fees and insurance. G&A as a percentage of sales does not increase commensurate with an increase in sales. Our largest expenses are payroll and rent and these are largely fixed and not variable. Our advertising and marketing expenses are controllable and variable depending on the particular market.
Same-Store Sales
We assess the organic growth of our sales on a same-store basis. We believe that our assessment on a same-store basis represents an important indicator of comparative financial results and provides relevant information to assess our performance. New and acquired stores become eligible for inclusion in the comparable store base if the store has been under our ownership for the entire period in the same-store base periods for which we are including the store. For example, our same store sales for the three months ended March 31, 2020 and 2019 includes stores that operated for the entire quarter in both 2020 and 2019. We do not include any stores that were closed or consolidated during a particular period.
16
Adjusted EBITDA
We define Adjusted EBITDA as net income (loss) before interest expense, income taxes, depreciation and amortization, further adjusted for other items such as non-cash equity compensation charges. See “—Use of Non-GAAP Financial Measure” for more information and a reconciliation of Adjusted EBITDA to net income (loss), the most directly comparable financial measure calculated and presented in accordance with GAAP.
The following table summarizes the comparison of our financial performance in the three months ended March 31, 2020 and 2019:
| For the Three Months Ended | Quarter to Quarter Comparison | |||||||||||||||
| March 31, | Increase/ | Percentage | ||||||||||||||
| 2020 | 2019 | (decrease) | Change | |||||||||||||
| Sales | $ | 32,981,506 | $ | 13,087,222 | $ | 19,894,284 | 152.0 | % | ||||||||
| Gross profit | $ | 8,946,249 | $ | 3,686,631 | $ | 5,259,618 | 142.7 | % | ||||||||
| Gross Profit % | 27.13 | % | 28.17 | % | ||||||||||||
| Operating expenses – store operations | $ | 3,638,685 | $ | 1,957,790 | $ | 1,680,895 | 85.9 | % | ||||||||
| Operating expenses – store operations as a % of sales | 11.03 | % | 14.96 | % | ||||||||||||
| Operating income from store operations(1) | $ | 5,307,564 | $ | 1,728,841 | $ | 3,578,723 | 207.0 | % | ||||||||
| Operating income from store operations, % of sales | 16.09 | % | 13.21 | % | ||||||||||||
| Same Store Sales(2) | $ | 15,186,018 | $ | 9,607,606 | $ | 5,578,412 | 58.1 | % | ||||||||
| Adjusted EBITDA(3) | $ | 2,710,437 | $ | 615,509 | $ | 2,094,928 | 340.4 | % | ||||||||
| (1) | Operating income from store operations is calculated as gross profit less operating expenses – store operations. |
| (2) | Same store sales for quarter ended March 31, 2020 and 2019 included fourteen stores; each of these stores operated under our ownership for the full quarter ended March 31 in 2020 and 2019. |
| (3) | See reconciliation in “—Use of Non-GAAP Financial Measure.” |
Our financial performance was improved in the first quarter of 2020, compared to the same quarter in the previous year. In the quarter ended March 31, 2020, sales were $33.0 million, an increase of 152%, compared to $13.1 million for the quarter ended March 31, 2019. Adjusted EBITDA was $2.7 million for the quarter ended March 31, 2020 compared to $615,000 for quarter ended March 31, 2019, an increase of 340%. Our same store sales for the fourteen stores that were operating under ownership during the entirety of 2020 and 2019 periods increased 58% for the quarter ended March 31, 2020 compared to the quarter ended March 31, 2019. Operating income from store operations was $5.3 million for the quarter ended March 31, 2020, compared to $1.7 million for the quarter ended March 31, 2019, an increase of 207%. Gross profit margin percentage was 27.1% for the first quarter of 2020, compared to 28.2% for the first quarter of 2019. We experienced increases in sales in all markets, most notably the California market (+53.3%) and Michigan market (+275.7%) period-over-period, primarily attributable to the growth of commercial and walk-in business at our garden centers located in these states. Our online business grew by 185% in the quarter ended March 31, 2020 compared to the quarter ended March 31, 2019.
17
The following table summarizes the comparison of our financial performance in the past two years:
| For the Year Ended | Year to Year Comparison | |||||||||||||||
| December 31, | Increase/ | Percentage | ||||||||||||||
| 2019 | 2018 | (decrease) | Change | |||||||||||||
| Sales | $ | 79,733,568 | $ | 29,000,730 | $ | 50,732,838 | 174.9 | % | ||||||||
| Gross profit | $ | 22,561,847 | $ | 6,444,558 | $ | 16,117,289 | 250.1 | % | ||||||||
| Gross Profit % | 28.3 | % | 22.2 | % | ||||||||||||
| Operating expenses – store operations | $ | 10,095,422 | $ | 5,202,330 | $ | 4,893,092 | 94.1 | % | ||||||||
| Operating expenses – store operations as a % of sales | 12.7 | % | 17.9 | % | ||||||||||||
| Operating income from store operations(1) | $ | 12,466,425 | $ | 1,242,228 | $ | 11,224,197 | 904 | % | ||||||||
| Operating income from store operations(1), % of sales | 15.6 | % | 4.3 | % | ||||||||||||
| Same Store Sales(2) | $ | 12,995,795 | $ | 9,528,453 | $ | 3,467,342 | 36.4 | % | ||||||||
| Adjusted EBITDA(3) | $ | 6,641,050 | $ | (823,843 | ) | $ | 7,464,893 | |||||||||
| (1) | Operating income from store operations is calculated as gross profit less operating expenses – store operations. |
| (2) | Same store sales for the year ended December 31, 2019 and 2018 included 6 stores; each of these stores was operated under our ownership for the full year ended December 31, 2019 and 2018. |
| (3) | See reconciliation in “—Use of Non-GAAP Financial Measure.” |
We improved our financial performance in 2019. In 2019, sales increased 175% to $79.7 million year-over-year. Adjusted EBITDA for 2019 was $6.6 million representing a positive $0.20 per share, basic. For a reconciliation of Adjusted EBITDA to net income, see “—Use of Non-GAAP Financial Information”. Our same store sales for the 15 stores that were operating under our ownership during the entire year in 2019 and 2018 increased approximately 36% year-over-year. Gross profit margins increased to 28.3%, an increase of 610 basis points year-over-year. We saw significant increases of sales in all key markets, including Colorado (+132%), California (+161%), Nevada (+127%), Michigan (+200%), and Rhode Island (+79%), year-over-year. Our new stores in Oklahoma contributed $11.8 million in net revenue and our stores in Maine added $6.2 million in net revenue. Our e-commerce store, growgeneration.com, added approximately $4.8 million in sales. Our commercial division generated approximately $17 million in sales. Along with our strong top-line growth, we reduced our operating expenses – store operations to 12.7% of sales in 2019 compared to 17.9% in 2018 and corporate overhead to 8.5% as a percentage of our sales, not including non-cash expenditures, from 11.2% in 2018. We successfully completed the implementation of our Enterprise Resource Planning (“ERP”) platform, designed to lower costs, integrate our online and store sales and supply channels, improve departmental productivity and provide forecasting and reporting tools.
In 2019, we continued focusing our efforts on increasing our footprint through acquisitions and openings of new locations. We increased our store footprint from 16 to 25 locations in 2019, inclusive of two store closings/consolidations. Net revenue increased 175% between 2018 and 2019. In September 2018, we acquired e-commerce operation, HeavyGarden.com and are currently rebranding it as growgeneration.com, which is being launched in late June 2020 and will serve as the base for our omni-channel strategy and will enable e-commerce at all of the GrowGeneration locations.
We have raised funds in private placements for $12.8 million from 19 accredited investors in 2019 and $19 million, primarily from the three private equity firms, Gotham Green Partners, Navy Capital and Merida Capital Partners, in 2018.
18
Summary of Acquisitions
The comparability of our results of operations between the periods discussed below is naturally affected by the acquisitions we have completed during such periods. We are also continuously evaluating and pursuing acquisitions on an ongoing basis, and such acquisitions, if completed, will continue to impact the comparability of our financial results. While we expect continued growth and strategic acquisitions in the future, our acquisitions may have materially different characteristics than our historical results, and such differences in economics may impact the comparability of our future results of operations to our historical results.
In 2020, we have made the following acquisition:
| ● | On February 25, 2020, we purchased the assets of Health & Harvest, LLC with one location in Pembroke Pines, FL. In connection with the purchase of the assets, we entered into an asset purchase agreement through our wholly-owned subsidiary, GrowGeneration Florida Corp, and a three-year commercial lease for warehouse space, effective February 26, 2020 and subleased the store space, with the current lease expiring July 31, 2020. |
The above acquisition will be fully reflected in our consolidated financial statements for the fiscal year ending December 31, 2021 but are only partially reflected in our consolidated financial statements for the quarter ended March 31, 2020 and the fiscal year ending December 31, 2020, beginning on the date of acquisition and do not impact our results of operations for the quarter ended March 31, 2019 and fiscal years 2019, 2018 and 2017.
Fiscal Year 2019 Acquisitions
In 2019, we made the following acquisitions and consolidations:
| ● | On December 18, 2019, we purchased the assets of Grow World LLC with one location in Portland, OR. In connection with the purchase of the assets, we entered into an asset purchase agreement through our wholly-owned subsidiary, GrowGeneration Washington Corp, and an assignment of lease, effective December 18, 2019, to rent the premises in Portland, OR. The lease terminates on December 31, 2026. |
| ● | On September 3, 2019, we purchased the assets of Grand Rapids Hydroponics with one location in Grand Rapids, MI. In connection with the purchase of the assets, we entered into an asset purchase agreement through our wholly-owned subsidiary, GrowGeneration Michigan Corp, and a ten-year commercial lease agreement, effective from September 9, 2019, to rent the premises in Grand Rapids, MI. |
| ● | On May 13, 2019, we purchased the assets of GreenLife Garden Supply Corp., with two store locations in Maine and one in New Hampshire. In connection with the purchase of the assets, we entered into an asset purchase agreement through our wholly-owned subsidiary, GrowGeneration Rhode Island Corp., and five-year commercial lease agreements, effective from May 9, 2019 and July 1, 2019, respectively, to rent the premises in York and Biddeford, Maine where store assets are located. |
| ● | On February 7, 2019, we purchased the assets of Palm Springs Hydroponics, Inc. located in Palm Springs, California. In connection with the purchase of the assets, we entered into an asset purchase agreement through our wholly-owned subsidiary, GrowGeneration California Corp., and a commercial lease agreement with a term of five years and three months, effective from February 7, 2019 to April 30, 2024, to rent the premises where the assets were located to open a new store. |
| ● | On February 11, 2019, we purchased the assets of Reno Hydroponics, Inc. located in Reno, Nevada. In connection with the purchase of the assets, we entered into an asset purchase agreement through our wholly-owned subsidiary, GrowGeneration Nevada Corp., and a one-year commercial lease agreement, effective from February 1, 2019 to January 31, 2020, to rent the premises where the assets were located to open a new store. We have since entered into a new lease expiring March 31, 2021. |
| ● | On January 22, 2019, we purchased the assets of Chlorophyll, Inc., located in Denver, Colorado. In connection with the purchase of the assets, we entered into an asset purchase agreement through our wholly-owned subsidiary, GrowGeneration Pueblo Corp., and a five-year commercial lease agreement, effective from January 21, 2019, to rent the premises where the assets were located to open a new store. |
| ● | In March 2019, we consolidated our store located in Canon City, CO with its Pueblo West, CO store. |
| ● | Effective January 1, 2019, our two Santa Rosa, CA stores were consolidated into a single store at our Santa Rosa Moorland location acquired in July 2018. |
We refer to the fiscal year 2019 acquisitions described above collectively as the “2019 Acquisitions.” The 2019 Acquisitions will be fully reflected in our consolidated financial statements for the fiscal year ending December 31, 2020 but are only partially reflected in our consolidated financial statements for the fiscal year ending December 31, 2019, beginning on the date of acquisition and do not impact our results of operations for fiscal years 2018 and 2017.
19
Fiscal Year 2018 Acquisitions
In 2018, we made the following acquisitions and consolidations:
| ● | On December 1, 2018, we entered into a lease agreement through our wholly-owned subsidiary, GrowGeneration Rhode Island, Corp., to rent certain premises located in Brewer, Maine, to be effective from December 1, 2018 to February 28, 2023. This premises were used by us to open a new store. |
| ● | In November 2018, we signed a commercial lease to open a 9,600 square feet warehouse and product showroom in Tulsa to service the emerging legal cannabis cultivators in the State of Oklahoma. The lease is effective from January 1, 2019 to December 31, 2024. We opened this store for business on February 1, 2019. |
| ● | In October 2018, we consolidated our store located in Boulder, CO with our Denver, CO store. |
| ● | On September 15, 2018, we purchased the assets of Virgus, Inc. d/b/a/ Heavy Gardens, an online store for hydroponic and garden supplies. In connection with the purchase, we entered into an asset purchase agreement through our wholly-owned subsidiary, GrowGeneration HG Corp. |
| ● | On August 23, 2018, we signed a commercial lease to open a 10,000 square feet warehouse and product showroom in Oklahoma City to service the emerging legal cannabis cultivators in the State of Oklahoma. The lease is effective from October 1, 2018 to September 30, 2023. We opened this store for business on October 1, 2018. |
| ● | On July 13, 2018, we purchased the assets of a retail hydroponic store, Santa Rosa Hydroponics & Grower Supply Inc., located in Santa Rosa, California. In connection with the purchase of the assets, we entered into an asset purchase agreement and a commercial lease agreement, effective from July 14, 2018 to July 13, 2023, to rent the premises where the assets were located. |
| ● | In May 2018, we consolidated our store located in Colorado Springs, CO with our Denver, CO store and in April 2018, consolidated its store located in Pueblo West with our Pueblo Downtown store. |
| ● | On April 12, 2018, we purchased substantially all of the assets of Superior Growers Supply, Inc.’s business located in Michigan. In connection with the purchase of the assets, we entered into an asset purchase agreement through our wholly-owned subsidiary, GrowGeneration Michigan Corp., and three leases to rent the premises where the assets were located. Following this acquisition, we opened three stores in the state of Michigan. |
| ● | On January 30, 2018, we purchased all of the assets of a retail hydroponic store, Humboldt Depot, located in Arcata, CA. In connection with the asset purchase, we entered into an asset purchase agreement through our wholly-owned subsidiary, GrowGeneration California, and two commercial leases, to be effective from February 1, 2018 to January 31, 2021, to rent the premises where the assets were located. |
| ● | On January 23, 2018, we purchased all of the assets of a retail hydroponic store, East Coast Hydroponic Warehouse, located in Warwick, RI. In connection with the purchase of the assets, we entered into an asset purchase agreement and a commercial lease, to be effective from January 24, 2018 to January 23, 2023, to rent the premises where the assets were located. |
We refer to the fiscal year 2018 acquisitions described above collectively as the “2018 Acquisitions.” The full impact of the 2018 Acquisitions is reflected in our consolidated financial statements for the fiscal year ending December 31, 2019 but were only partially reflected in our consolidated financial statements for the fiscal year ended December 31, 2018, beginning on the date of acquisition and do not impact our results of operations in fiscal year 2017.
Fiscal Year 2017 Acquisitions
In 2017, we made the following acquisitions and consolidations:
| ● | Effective as of December 31, 2017, we consolidated our store located in Denver north with our Denver south store and warehouse facility we leased on February 1, 2017. |
20
| ● | On September 19, 2017, we entered into a commercial lease, effective from October 1, 2017 to November 30, 2021, to rent certain office and warehouse space located in North Las Vegas, Nevada, to open its fourteenth store. |
| ● | On August 15, 2017, we entered into a commercial lease to rent certain premises located in Boulder, Colorado, to be effective from September 1, 2017 to August 31, 2019 and opened a new store. |
| ● | On April 25, 2017, we entered into a commercial lease through GrowGeneration California to rent certain premises located in San Bernardino, California, to be effective from May 1, 2017 to May 1, 2020. The premises was used by us to operate as a new store. |
| ● | On February 8, 2017, we purchased certain assets of a retail hydroponic and garden supply business located in Santa Rosa, CA. In connection with the asset purchase, we entered into an asset purchase agreement through our wholly-owned subsidiary, GrowGeneration California, as well as a commercial lease, effective from March 1, 2017 to February 28, 2022, to rent the premises where the assets were located. In connection therewith, we closed its then existing store in Santa Rosa and consolidated those operations with the new store. |
| ● | On February 1, 2017, we entered into a commercial lease to rent certain 12,837 square feet premises located in Denver, Colorado, to be effective from February 1, 2017 to February 1, 2022, to open a new retail store, warehouse space and offices. |
| ● | On January 30, 2017, we entered into a commercial lease to rent certain 7,383 square feet premises located in Trinidad, Colorado, to be effective from March 1, 2017 to February 28, 2022, which was used by us to open a new store to replace and consolidate its then existing 3,000 square feet store in Trinidad as part of our expansion plan. |
We refer to the fiscal year 2017 acquisitions described above collectively as the “2017 Acquisitions.” The full impact of the 2017 Acquisitions is reflected in our consolidated financial statements for the fiscal years ended December 31, 2019 and 2018 but were only partially reflected in our consolidated financial statements for the fiscal year ending December 31, 2017, beginning on the date of acquisition.
RESULTS OF OPERATIONS
Comparison of the Quarters Ended March 31, 2020 and 2019
The following table presents certain consolidated statement of operations information and presentation of that data as a dollar and percentage change period-over-period. See above for a discussion on comparability of results of operations regarding our acquisitions in “—Summary of Acquisitions” above.
| Three Months Ended March 31, 2020 | Three Months Ended March 31, 2019 | $ Variance | % Variance | |||||||||||||
| Sales | $ | 32,981,506 | $ | 13,087,222 | $ | 19,894,284 | 152 | % | ||||||||
| Cost of goods sold | 24,035,257 | 9,400,591 | 14,634,666 | 156 | % | |||||||||||
| Gross profit | 8,946,249 | 3,686,631 | 5,259,618 | 143 | % | |||||||||||
| Operating expenses | 11,063,232 | 3,337,120 | 7,726,112 | 232 | % | |||||||||||
| Operating (loss) income | (2,116,983 | ) | 349,511 | (2,466,494 | ) | |||||||||||
| Other income (expense) | 23,465 | (120,090 | ) | 143,555 | ||||||||||||
| Net (loss) income | $ | (2,093,518 | ) | $ | 229,421 | $ | (2,322,939 | ) | ||||||||
Sales for the three months ended March 31, 2020 was approximately $33 million, compared to approximately $13.1 million for the three months ended March 31, 2019, which was an increase of approximately $19.9 million, or 152%. The increase was primarily due to the following factors:
| ● | seven new stores opened or acquired at various times in 2019 and 2020 which had sales of $9 million for the quarter ended March 31, 2020 for which there were no sales for the quarter ended March 31, 2019; |
| ● | five stores opened or acquired in early 2019, that had sales of $6.8 million for the quarter ended March 31, 2020 compared to sales of $2.4 million for the quarter ended March 31, 2019; |
| ● | an increase in the 14 same store sales of 58% during the quarter ended March 31, 2020 as compared to the quarter ended March 31, 2019 (see table below); and |
| ● | an increase in e-commerce sales of $1.3 million, or 185%, for the quarter ended March 31, 2020 compared to the quarter ended March 31, 2019. The increase in same store sales at fourteen of our locations contributed sales of $15.2 million for the quarter ended March 31, 2020 compared to sales of $9.6 million for the quarter ended March 31, 2019, a 58% increase. |
21
We currently focus on ten markets, our new e-commerce website, growgeneration.com, and growth opportunities that exist in each market. We continue to focus on new store acquisitions and openings, private label products and the continued development of our online sales through growgeneration.com and sales through our Amazon.com store and direct sales to Amazon.com.
| Sales by Market | ||||||||||||||||
| Three Months Ended March 31, 2020 | Three Months Ended March 31, 2019 | Variance | % Variance | |||||||||||||
| Colorado | $ | 4,125,453 | $ | 3,338,273 | $ | 787,180 | 23.6 | % | ||||||||
| California | 4,282,312 | 2,793,171 | 1,489,141 | 53.3 | % | |||||||||||
| Rhode Island | 3,781,591 | 1,497,982 | 2,283,609 | 152.4 | % | |||||||||||
| Michigan | 5,796,581 | 1,542,851 | 4,253,730 | 275.7 | % | |||||||||||
| Nevada | 1,193,255 | 867,647 | 325,608 | 37.5 | % | |||||||||||
| Washington | 364,520 | 327,297 | 37,223 | 11.4 | % | |||||||||||
| Oregon | 1,655,852 | - | 1,655,852 | - | ||||||||||||
| Oklahoma | 6,293,564 | 1,552,749 | 4,740,815 | 305.3 | % | |||||||||||
| Maine | 2,980,538 | 54,065 | 2,926,473 | 5,412.9 | % | |||||||||||
| Florida | 559,340 | - | 559,340 | - | ||||||||||||
| E-commerce (growgeneration.com) | 1,944,687 | 681,299 | 1,263,388 | 185.4 | % | |||||||||||
| Closed/consolidated locations | 3,813 | 431,888 | (428,077 | ) | - | |||||||||||
| Total sales | $ | 32,981,506 | $ | 13,087,222 | $ | 19,894,284 | 152 | % | ||||||||
Sales in the Colorado market increased approximately $787,000 or 23.6% in the quarter ended March 31, 2020 compared to March 31, 2019. The increase in sales in the Colorado market was primarily due to our continued focus on increasing commercial sales, and the acquisition of a new store in mid-January 2019. Same store sales for four stores in Colorado increased approximately $703,000 in the three months ended March 31, 2020 compared to the same period in 2019.
Sales in the California market increased approximately $1.5 million, or 53.3%, in the quarter ended March 31, 2020 compared to March 31, 2019. Same store sales in the California market increased approximately $879,000 over the same quarter in 2019 and the Palm Springs center (acquired in mid-February 2019) had sales of approximately $1 million, representing a $610,000 increase, or 152%, over the same period in 2019.
Sales in the Rhode Island market increased approximately $2.3 million, or 152.4%, period-over period primarily due to our increased focus on commercial and multi-state commercial customers.
Sales in the Michigan market increased approximately $4.3 million, or 275.7%, period-over-period due to an acquisition in September 2019 that contributed $2.7 million in sales in the quarter ended March 31, 2020 and an increase in same store sales for three stores of $1.5 million, or 97%, period-over-period primarily due to the increase in commercial accounts.
Sales in the Nevada market increased 37.5% due to the acquisition of our Reno store in February 2019 which had sales of $650,000 in the quarter ended March 31, 2020 compared to revenues of $386,000 for the quarter ended March 31, 2019 and a 13% increase in same store sales in the Las Vegas store, period-over-period.
Sales in the Washington market increased 11.4% for the quarter ended March 31, 2020 compared to the quarter ended March 31, 2019. Washington currently is one of our smaller markets.
Sales in Oregon were approximately $1.7 million. Oregon represents a new market for us as we completed our first acquisition in the market in mid-December 2019.
22
Currently we have four stores in the Oklahoma market. Sales in the Oklahoma market increased $4.7 million or 305.3% in the quarter ended March 31, 2020 compared to the quarter ended March 31, 2019. The increase in sales was primarily related to the addition on the three new stores. Same stores sales for one store increased 8% in Oklahoma City year-over-year.
Sales in Maine have increased $2.9 million for the quarter ended March 31, 2020 compared to the quarter ended March 31, 2019. The increase was primarily due to a new store opened January 31, 2019 and two new stores acquired in May 2019. The new store acquired in January 2019 had sales of $757,500 in the quarter ended March 31, 2020 compared to $54,000 for the quarter ended March 31, 2019. The two new stores acquired in May 2019 contributed $2.2 million in sales for the quarter ended March 31, 2020.
Florida was a new market resulting from an acquisition in February 2020. Sales in this market were $559,000 for the quarter ended March 31, 2020.
We generated same-store sales for 14 stores which operated under our ownership during the entire period during the quarters ended March 31, 2020 and 2019 in the following markets: four in Colorado, three in California, three in Michigan, one in Nevada, one in Rhode Island, one in Washington and one in Oklahoma. These stores generated approximately $15.2 million in sales for the three months ended March 31, 2020, compared to approximately $9.6 million in sales for the three months ended March 31, 2019, an increase of 58%, primarily due to an increase in the number of commercial customers in these markets. Same store sales increased in all of the markets as noted below comparing March 31, 2020 to March 31, 2019.
| Same Store Sales By Market | ||||||||||||||||
| Three Months Ended | Three Months Ended | |||||||||||||||
| March 31, 2020 | March 31, 2019 | Variance | % Variance | |||||||||||||
| Colorado market | $ | 2,719,924 | $ | 2,016,826 | 703,098 | 35 | % | |||||||||
| Rhode Island | 3,781,591 | 1,497,982 | 2,283,609 | 152 | % | |||||||||||
| Michigan | 3,044,737 | 1,542,851 | 1,501,886 | 97 | % | |||||||||||
| Oklahoma | 1,460,366 | 1,348,234 | 112,132 | 8 | % | |||||||||||
| California market | 3,272,547 | 2,393,163 | 879,384 | 37 | % | |||||||||||
| Washington market | 364,520 | 327,297 | 37,223 | 11 | % | |||||||||||
| Nevada market | 542,333 | 481,253 | 61,080 | 13 | % | |||||||||||
| Net revenue, all markets | $ | 15,186,018 | $ | 9,607,606 | $ | 5,578,413 | 58 | % | ||||||||
Cost of Goods Sold
Cost of goods sold for the quarter ended March 31, 2020 was approximately $24 million compared to approximately $9.4 million for the quarter ended March 31, 2019, which represented an increase of approximately $14.6 million, or 156%, from the previous period. The increase in cost of goods sold was primarily due to the 152% increase in sales during the quarter ended March 31, 2020 compared to the quarter ended March 31, 2019. The increase in cost of goods sold is directly attributable to the increase in the number of stores open during the quarter ended March 31, 2020 compared to the quarter ended March 31, 2019, as discussed above.
Gross profit was approximately $8.9 million for the quarter ended March 31, 2020 compared to approximately $3.7 million for the quarter ended March 31, 2019, an increase of approximately $5.3 million, or 143%. The increase in cost of goods sold is primarily related to the 152% increase in sales for the quarter ended March 31, 2020 compared to the quarter ended March 31, 2019. Gross profit as a percentage of sales was 27.1% for the quarter ended March 31, 2020, compared to 28.2% for the quarter ended March 31, 2019. The decrease in the gross profit margin percentage was due to a greater percentage of our sales in the quarter ended March 31, 2020 resulting from larger commercial and e-commerce sales, which have lower margins. Commercial and e-commerce sales accounted for approximately 32% of overall sales for the quarter ended March 31, 2020, resulting in a margin reduction of approximately 0.8%.
23
Operating Expenses
Operating expenses are comprised of store operations expenses, primarily payroll, rent and utilities, and corporate overhead. Store operating expenses were approximately $3.6 million for the quarter ended March 31, 2020 and approximately $2 million for the quarter ended March 31, 2019, an increase of approximately $1.6 million or 86%. The increase in store operating costs was directly attributable to the addition of six new locations after March 31, 2019, and six locations added at various times during the quarter ended March 31, 2019 that were open for the entire quarter ended March 31, 2020. Effective April 1, 2019 we opened two warehouse distribution facilities. The addition of these 12 new stores and the two new warehouse facilities were the primary reasons for the increase in store operating costs. Store operating expenses as a percentage of sales were 11% for the quarter ended March 31, 2020 compared to 15% for the quarter ended March 31, 2019, a 26% reduction. Store operating expenses were positively impacted by the opening of new and acquired stores throughout 2019 and the one acquisition in February 2020. These stores have a lower percentage of operating expenses to sales due to their larger size and higher volume. As noted above, same store sales for fourteen stores increased 58% for the quarter ended March 31, 2020 compared to the quarter ended March 31, 2019, which also contributed to a reduction in the store operating expenses as a percentage of sales with respect to these fourteen stores.
Corporate overhead, comprised of general and administrative costs, share based compensation, depreciation and amortization and corporate salaries, was approximately $7.4 million for the quarter ended March 31, 2020, compared to approximately $1.4 million for the quarter ended March 31, 2019. Corporate overhead was 22.5% of sales for the quarter ended March 31, 2020 and 10.5% for the quarter ended March 31, 2019. The increase in corporate overhead as a percentage of sales for the quarter ended March 31, 2020 was primarily due to the increase in non-cash share based compensation from approximately $80,000 for the quarter ended March 31, 2019 to approximately $4.1 million for the quarter ended March 31, 2020.
The increase in non-cash share-based compensation was primarily the result of several new executive employment agreements which became effective January 1, 2020 and resulted in the vesting of common stock and common stock options at the start of the quarter, as well as options issued in 2018 and 2019 for options vesting in 2020. The share-based awards associated with the new executive employment agreements resulted in approximately one-third of the award being recognized as an expense in the first quarter of 2020, due to vesting. The remaining two-thirds on the share-based awards are being recognized over a 24-month period commencing January 2020 and ending December 2021, based on shared based award vesting in future periods. The vesting of these shares and options was significantly higher in the first quarter of 2020 than they will be in the periods subsequent to March 31, 2020. The non-cash share-based compensation for the remainder of 2020 is substantially less per quarter than the amount recorded in the first quarter of 2020, based on current awards outstanding, and is estimated to be approximately $2.4 million for the remainder of 2020.
The increase in salaries expense from the quarter ended March 31, 2019 to the quarter ended March 31, 2020 was due primarily to the increase in corporate staff to support expanding operations, including store manager integrations, accounting and finance, information systems, purchasing and commercial sales staff. When we consummate a new acquisition, purchasing and back office accounting functions are stripped from the new acquisitions and those functions are absorbed into our existing centralized purchasing and accounting and finance departments. Corporate salaries and related payroll costs as a percentage of sales were 5.5% for the quarter ended March 31, 2020 compared to 5% for the quarter ended March 31, 2019. General and administrative expenses comprised mainly of advertising and promotions, travel & entertainment, professional fees and insurance were approximately $1.15 million for the quarter ended March 31, 2020 and approximately $493,000 for the quarter ended March 31, 2019. A majority of the increase was related to advertising and promotion, travel and entertainment and legal fees. General and administrative expenses as a percentage of sales were 3.5% for the quarter ended March 31, 2020, and 3.8% for the quarter ended March 31, 2019. Corporate overhead, which includes non-cash expenses consisting primarily of depreciation and share based compensation, was approximately $4.5 million for the quarter ended March 31, 2020, compared to approximately $227,000 for the quarter ended March 31, 2019.
Net Income (Loss)
Net loss for the quarter ended March 31, 2020 was approximately $2.1 million compared to net income of approximately $229,000 for the quarter ended March 31, 2019, a reduction of approximately $2.3 million. The net loss for the quarter ended March 31, 2020 was primarily due to the increase in share-based compensation from approximately $80,000 in 2019 to $4.1 million for the quarter ended March 31, 2020. Net income from store operations was approximately $5.3 million for the quarter ended March 31, 2020, compared to approximately $1.7 million for the quarter ended March 31, 2019. Operating expenses for store operations were offset by increased corporate overhead of approximately $7.4 million for the quarter ended March 31, 2020 compared to approximately $1.4 million for the quarter ended March 31, 2019. This increase of $6 million was primarily related to the increase in non-cash share-based compensation expense of approximately $4.1 million. Increases in G&A and salaries in the quarter ended March 31, 2020 compared to the quarter ended March 31, 2019 accounted for the remaining increase.
24
Comparison of the Years Ended December 31, 2019 and 2018
The following table sets forth information from our statements of operations for the years ended December 31, 2019 and 2018:
| For the Year Ended | Year to Year Comparison | |||||||||||||||
| December 31, | Increase/ | Percentage | ||||||||||||||
| 2019 | 2018 | (decrease) | Change | |||||||||||||
| Sales | $ | 79,733,568 | $ | 29,000,730 | $ | 50,732,838 | 174.9 | % | ||||||||
| Cost of Sales | 57,171,721 | 22,556,172 | 34,615,549 | 153.5 | % | |||||||||||
| Gross profit | 22,561,847 | 6,444,558 | 16,117,289 | 250.1 | % | |||||||||||
| Operating expenses | 20,421,726 | 10,700,206 | 9,721,520 | 90.9 | % | |||||||||||
| Income (loss) from operations | 2,140,121 | (4,255,648 | ) | 6,395,769 | 298.8 | % | ||||||||||
| Other income (expense) | (261,317 | ) | (818,107 | ) | 556,790 | |||||||||||
| Net Income (loss) | $ | 1,878,804 | $ | (5,073,755 | ) | $ | 6,952,559 | 370.1 | % | |||||||
Sales
Sales for the year ended December 31, 2019 were approximately $79.7 million compared to approximately $29 million for the year ended December 31, 2018, an increase of $50.7 million, or 175%. The increase in sales is due to the addition of ten new retail stores opened or acquired during 2019 for which there were no sales for these retail stores for the year ended December 31, 2018 as well as eight stores and the e-commerce site opened or acquired at various times during 2018 that were open for all of 2019. Sales in the ten new stores opened or acquired in 2019 were $26 million. Sales from our e-commerce site and the eight stores opened in 2018 were approximately $38.3 million for the year ended December 31, 2019 compared to approximately $14.5 million for the year ended December 31, 2018. We also had store closures and consolidations in 2019 and 2018. Sales of the closed and consolidated stores were approximately $909,000 for the year ended December 31, 2019 and approximately $4.5 million for the year ended December 31, 2018.
While we continued to focus on the nine markets noted below and the growth opportunities that exist in each market, we also are focusing on new store acquisitions, proprietary products, and developing our online sales through growgeneration.com and sales through our Amazon.com store and direct sales to Amazon.com.
| Sales by Market | ||||||||||||
| Year Ended December 31, 2019 | Year Ended December 31, 2018 | Variance | ||||||||||
| Colorado market | $ | 15,490,021 | $ | 6,665,197 | $ | 8,824,824 | ||||||
| California market | 15,570,418 | 5,964,080 | 9,606,338 | |||||||||
| Rhode Island market | 8,395,123 | 4,700,102 | 3,695,021 | |||||||||
| Michigan market | 9,268,460 | 3,086,693 | 6,181,767 | |||||||||
| Maine market | 6,203,649 | - | 6,203,649 | |||||||||
| Nevada market | 4,360,013 | 1,924,025 | 2,435,988 | |||||||||
| Washington market | 1,283,169 | 939,231 | 343,938 | |||||||||
| Oklahoma market | 11,793,303 | 463,264 | 11,330,039 | |||||||||
| Oregon market | 153,856 | - | 153,856 | |||||||||
| Closed/consolidated locations | 908,642 | 4,473,222 | (3,564,580 | ) | ||||||||
| Hemp market | 1,583,176 | - | 1,583,176 | |||||||||
| E-commerce site | 4,763,738 | 784,916 | 3,978,822 | |||||||||
| Total revenues | $ | 79,773,568 | $ | 29,000,730 | $ | 50,772,838 | ||||||
Overall sales in the Colorado market increased approximately $8.8 million or 132%, as noted above, comparing the year ended December 31, 2019 to the year ended December 31, 2018, with a majority of that increase, $6 million, attributable to the acquisition of our new Denver north store location in January 2019. The remaining Colorado stores saw an increase of approximately $2.8 million from 2018 to 2019. We continued to focus selling efforts in building growth in this market primarily in the commercial market.
Our sales in the California market experienced growth of approximately $9.6 million, or 161%, primarily from the addition of 5 new stores through acquisitions during 2018. These five stores contributed sales of $15.6 million in 2019 compared to $6 million in 2018.
Sales in the Rhode Island and Michigan markets are the result of new acquisitions in 2018 and one acquisition in Michigan in 2019. Rhode Island sales increased $3.7 million from 2018 to 2019, an increase of 79% and sales in Michigan increased $6.2 million or 200% from 2018 to 2019. Increases in commercial sales were the primary driver of the overall increase in both Rhode Island and Michigan.
25
Maine was a new market in 2019 as a result of us opening a new store in February 2019 and the acquisition of two stores in May 2019.
Our revenue in the Nevada market increased by approximately $2.4 million in the year ended December 31, 2019 compared to year ended December 31, 2018, primarily due to the acquisition of our Reno location in February 2019. This location contributed $2.1 million in sales in 2019. Our Las Vegas store had an increase in sales of $329,000, or 17%, from 2018 to 2019. We continued to focus on adding commercial customers in the Nevada market.
Sales in the Washington market increased $344,000, or 37%, from 2018 to 2019, as we continued to focus on adding commercial customers in this location.
Oregon was a new market in 2019 with an acquisition of a new store in December 2019.
We opened our first store in Oklahoma in October 2018, followed by new store openings in February 2019 and November 2019. Oklahoma has been a significant new market for us by contributing sales of $11.8 million in 2019 compared to $463,000 in 2018. We have a strong presence in this market and opened our fourth location in March 2020. Oklahoma has generated strong sales in both commercial and non-commercial customers.
We had six stores (four in Colorado, one in Washington and one in Nevada) opened for the entire year ended December 31, 2019 and 2018 which are included in our same store sales table below. These stores generated $13 million in sales for the year ended December 31, 2019 compared to $9.5 million in sales for the same period ended December 31, 2018, an increase of 36.4%. The increase in sales in these six stores was primarily related to an increase in commercial sales.
| Same Store Sales | ||||||||||||
| Year ended | Year ended | |||||||||||
| December 31, 2019 | December 31, 2018 | Variance | ||||||||||
| Colorado | $ | 9,459,465 | $ | 6,665,197 | $ | 2,794,268 | ||||||
| Washington | 1,283,169 | 939,231 | 343,938 | |||||||||
| Nevada | 2,253,161 | 1,924,025 | 329,136 | |||||||||
| Sales | $ | 12,995,795 | $ | 9,528,453 | $ | 3,467,342 | ||||||
Cost of Goods Sold
Cost of goods sold, consisting of cost of product sold and freight, for the year ended December 31, 2019 increased approximately $34.6 million, or 153.5%, to $57.2 million, compared to $22.6 million for the year ended December 31, 2018. The increase in cost of goods sold was due to the 174.9% increase in sales for the year ended December 31, 2018 to 2019 compared primarily due to the increase in the number of stores between 2018 and 2019 as noted above.
Gross profit was $22.6 million for the year ended December 31, 2019, as compared to $6.4 million for the year ended December 31, 2018, which was an increase of approximately $16.1 million, or 250.1%. Gross profit as a percentage of sales was 28.3% for the year ended December 31, 2019 compared to 22.2% for the year ended December 31, 2018. The increase in the gross profit margin percentage in 2019 was due to reduced pricing from vendors as a result of our increasing purchases from those vendors; and the sale to customers of products acquired by us in a large bulk purchase at a substantial discount in the first quarter of 2019. The increase in the gross profit percentage was also due to the slight decrease in non-cash inventory valuation adjustments of approximately $870,000 in 2018, compared to $809,000 in 2019. The inventory valuation adjustments consist of a reserve for obsolete inventory as well as the write down of inventory resulting from physical inventory counts and to its current fair market value where that is lower than cost.
Operating Expenses
Operating expenses are comprised of store operations, primarily payroll, rent and utilities, and corporate overhead. Store operating expenses were approximately $10.1 million for the year ended December 31, 2019 compared to approximately $5.2 million for the year ended December 31, 2018, an increase of approximately $4.9 million or 94%. The increase in store operating costs was due to the addition of ten new stores in 2019 and 9 new stores 2018. Sales increased 174.9%, but store operating expenses increased only 94%. Store operating expenses as a percentage of sales were 12.7% for the year ended December 31, 2019, compared to 18% for the year ended December 31, 2018, a 29% reduction of store operating costs as a percentage of revenues. Store operating costs were positively impacted by the acquisitions of new stores in 2018 and 2019 which have a lower percentage of operating expenses to sales due to their larger size and higher volume. The net impact, as noted above, resulted in lower store operating expenses as a percentage of sales.
26
Corporate overhead is comprised of share-based compensation, depreciation and amortization, general and administrative costs and corporate salaries and related expenses and was approximately $10.3 million for the year ended December 31, 2019, compared to approximately $5.5 million for the year ended December 31, 2018. Corporate overhead costs were 13% of sales for the year ended December 31, 2019 compared to 18.9% for the year ended December 31, 2018. The increase in salaries and related expenses from 2018 to 2019 was due to the increase in corporate staff, primarily accounting and finance, inventory management, sales, information technology and store operations to support both current and future operations and to increase stores commercial sales. Corporate salaries as a percentage of sales were 4.5% for the year ended December 31, 2019 and 5.7% for the year ended December 31, 2018. The decrease in this percentage was due to corporate staff costs not rising directly commensurate with the increase in sales. To the extent current corporate staff levels do not rise commensurate with an increase in sales in the future, the percentage of salaries to sales would decline.
General and administrative expenses, comprised mainly of advertising and promotions, travel & entertainment, professional fees and insurance, were approximately $3.2 million for the year ended December 31, 2019 and approximately $1.6 million for the year ended December 31, 2018 with a majority of the increase in advertising and promotion and travel and entertainment. General and administrative costs as a percentage of revenue were 4% for the year ended December 31, 2019, compared to 5.5% for the year ended December 31, 2018. This percentage decreased because general and administrative costs did not increase commensurate with the increase in revenues.
Corporate overhead includes non-cash expenses, consisting primarily of depreciation and share-based compensation, which was approximately $3.5 million for the year ended December 31, 2019 compared to approximately $2.2 million for the year ended December 31, 2018.
Net Income (Loss)
Net income for the year ended December 31, 2019 was approximately $1.9 million compared to a loss of approximately $5.1 million for the year ended December 31, 2018, an increase of $6.9 million. Net income for 2019 compared to the net loss for 2018 was primarily due to the increase in sales being higher than the increase in cost of goods sold thereby increasing the gross profit margin and gross profit by $16.1 million in 2019. Store operating expenses increased by $4.9 million in 2019 compared to 2018, resulting in store operations contributing $11.2 million more in gross profit in 2019 than in 2018. As noted above, corporate overhead also increased $4.9 million over 2018.
Use of Non-GAAP Financial Information
Adjusted EBITDA is not a recognized term under generally accepted accounting principles in the U.S. (“GAAP”) and does not purport to be an alternative to net income (loss) as a measure of operating performance. We present Adjusted EBITDA because it is a primary measure used by management to evaluate operating performance. We believe the presentation of Adjusted EBITDA enhances our investors’ overall understanding of the financial performance of our business and provides meaningful supplemental information to both management and investors, facilitating the evaluation of performance across reporting periods. We also use this non-GAAP measure for internal planning and reporting purposes.
We define “Adjusted EBITDA” as Net income (loss) before interest, depreciation and amortization, as well as certain other items, such as lease termination fees, audit fees related to business combinations, non-cash operating lease expense, inventory valuation adjustments, amortization of debt discount and share-based compensation (option comp, warrant comp, stock issued for services).
We believe that Adjusted EBITDA is frequently used by securities analysts, investors and other interested parties in their evaluation of companies, many of which present an Adjusted EBITDA measure when reporting their results. We compensate for the limitations of using non-GAAP financial measures by using them to supplement GAAP results to provide a more complete understanding of the factors and trends affecting the business than GAAP results alone. Because not all companies use identical calculations, our presentation of Adjusted EBITDA may not be comparable to other similarly titled measures of other companies.
27
Adjusted EBITDA have limitations as an analytical tool and should not be considered in isolation or as a substitute for analyzing our results as reported under GAAP. Some of these limitations are:
| ● | Adjusted EBITDA does not reflect changes in, or cash requirements for, our working capital needs; |
| ● | Adjusted EBITDA does not reflect our interest expense, or the requirements necessary to service interest or principal payments on debt; |
| ● | Adjusted EBITDA does not reflect our income tax expenses or the cash requirements to pay our taxes; |
| ● | Adjusted EBITDA does not reflect historical cash expenditures or future requirements for capital expenditures or contractual commitments; and |
| ● | although depreciation and amortization charges are non-cash charges, the assets being depreciated and amortized will often have to be replaced in the future, and Adjusted EBITDA does not reflect any cash requirements for such replacements. |
Set forth below is a reconciliation of Adjusted EBITDA to net income (loss) for the quarter ended March 31, 2020 and 2019:
| Three Months Ended | ||||||||
| March 31, 2020 | March 31, 2019 | |||||||
| Net income (loss) | $ | (2,093,518 | ) | $ | 229,421 | |||
| Interest | 7,181 | 6,961 | ||||||
| Depreciation and Amortization | 359,142 | 146,624 | ||||||
| EBITDA | (1,727,195 | ) | 383,006 | |||||
| Non-cash operating lease expense | 121,636 | 27,279 | ||||||
| Share based compensation (option compensation, warrant compensation, stock issued for services) | 4,115,068 | 80,278 | ||||||
| Inventory adjustments | 200,928 | - | ||||||
| Amortization of debt discount | - | 124,946 | ||||||
| Adjusted EBITDA | $ | 2,710,437 | $ | 615,509 | ||||
| Adjusted EBITDA per share, basic | $ | .07 | .02 | |||||
| Adjusted EBITDA per share, diluted | $ | .06 | .02 | |||||
Set forth below is a reconciliation of Adjusted EBITDA to net income (loss) for the year ended December 31, 2019 and 2018:
| Year ended | ||||||||
| December 31, 2019 | December 31, 2018 | |||||||
| Net Income (loss) | $ | 1,878,804 | $ | (5,073,755 | ) | |||
| Interest | 45,191 | 23,565 | ||||||
| Depreciation and Amortization | 1,044,553 | 351,070 | ||||||
| EBITDA | 2,968,548 | (4,699,120 | ) | |||||
| Lease termination fees | - | 35,000 | ||||||
| Audit fees related to business combinations | - | 85,200 | ||||||
| Non-cash operating lease expense | 16,375 | - | ||||||
| Inventory valuation adjustments | 809,286 | 870,257 | ||||||
| Amortization of debt discount | 356,306 | 989,601 | ||||||
| Share based compensation (option comp, warrant comp, stock issued for services) | 2,490,535 | 1,895,219 | ||||||
| Adjusted EBITDA | $ | 6,641,050 | $ | (823,843 | ) | |||
| Adjusted EBITDA per share, basic | $ | 0.20 | $ | (0.04 | ) | |||
| Adjusted EBITDA per share, diluted | $ | 0.17 | $ | (0.04 | ) | |||
28
LIQUIDITY AND CAPITAL RESOURCES
We believe that existing cash and cash equivalents are sufficient to fund existing operations for the next twelve months. Our primary requirements for liquidity have been to fund our working capital needs, capital expenditures, general corporate needs, as well as to invest in or acquire companies that are synergistic with our business. To date we have financed our operations through the sale of Common Stock, exercise of warrants and convertible debentures. Currently, we have no demands, commitments or uncertainties that would reduce our current working capital. Our core strategy continues to focus on expanding our geographic reach across the United States through organic growth and acquisitions. Based on our strategy we intend to raise additional capital in the future through equity offerings and/or debt financings.
For the Three Months Ended March 31, | For the December 31, | |||||||||||||||
| 2020 | 2019 | 2019 | 2018 | |||||||||||||
$ (Unaudited) | $ (Unaudited) | $ (Audited) | $ (Audited) | |||||||||||||
| Net cash provided by (used in): | ||||||||||||||||
| Operating activities | $ | 751,672 | $ | (2,461,569 | ) | $ | (3,339,260 | ) | $ | (1,541,031 | ) | |||||
| Investing activities | (2,761,396 | ) | (5,519,723 | ) | (11,810,680 | ) | (6,367,311 | ) | ||||||||
| Financing activities | 471,505 | (97,835 | ) | 13,489,403 | 21,333,058 | |||||||||||
Working Capital
As of March 31, 2020, we had working capital of approximately $31.7 million, compared to working capital of approximately $30.6 million as of December 31, 2019, an increase of approximately $1.1 million. The increase in working capital was due primarily to proceeds from the exercise of warrants totaling approximately $510,000 during the three months ended March 31, 2020.
As of December 31, 2019, we had working capital of approximately $30.6 million, compared to working capital of approximately $21.6 million as of December 31, 2018, an increase of approximately $9 million. The increase in working capital from December 31, 2018 to December 31, 2019 was due primarily to the proceeds from the sale of our common stock, par value $0.01, proceeds for a convertible debt offering and exercise of warrants totaling approximately $13.9 million. At December 31, 2019, we had cash and cash equivalents of approximately $13 million.
Operating Activities
Net cash provided by operating activities for the quarter ended March 31, 2020 was approximately $.75 million compared to net cash used by operating activities of approximately $2.5 million for the quarter ended March 31, 2019. Cash used in operating activities is driven by our net income (loss) and adjusted by non-cash items as well as changes in operating assets and liabilities. Non-cash adjustments primarily include depreciation, amortization of intangible assets, share based compensation expense and amortization of debt discount. Non-cash adjustments totaled approximately $4.5 million and approximately $351,000 for the quarter ended March 31, 2020 and 2019, respectively. Non-cash adjustments had a positive impact on net cash used in operating activities for the three months ended March 31, 2020 than the same period in 2019. The net cash provided by operating activities of $752,000 for the quarter ended March 31, 2020 compared to the net cash used in operating activities for the quarter ended March 31, 2019, of approximately $2.5 million. This was primarily related to the net loss of approximately $2.1 million for the quarter ended March 31, 2020 due to net increases in inventory and prepaids of approximately $6.8 million offset by positive non-cash adjustments of approximately $4.5 million and increases in accounts payable, customer deposits and other current liabilities of approximately $5.3million.
Net cash used in operating activities for the quarter ended March 31, 2019 was approximately $2.5 million. This amount was primarily related to net income of approximately $229,000 due to positive non-cash adjustments of approximately $351,000 and an increase in accounts payable and other current liabilities of approximately $1.8 million offset by increases of inventory of approximately $4.1 million, accounts receivable of approximately $215,000 and prepaids of approximately $619,000.
Net cash used in operating activities for the year ended December 31, 2019 was approximately $3.3 million, compared to $1.5 million for the year ended December 31, 2018, an increase of approximately $1.8 million. Cash provided by operating activities is driven by our net income (loss) and adjusted by non-cash items as well as changes in operating assets and liabilities. Non-cash adjustments primarily include depreciation, amortization of intangible assets, share based compensation expense and changes in valuation allowances. Non-cash adjustment totaled approximately $4.4 million and approximately $3.4 for the years ended December 31, 2019 and 2018, respectively, resulting in the non-cash adjustments having a greater impact on net cash provided by operating activities for the year ended December 31, 2019 than the same period in 2018. Despite net income of $1.9 million and non-cash adjustments of $4.4 million for 2019, these positive adjustments were offset by increases in inventory of $10.5 million, increases in trade receivable of $3.8 million and increases in other current assets of $2.1 million offset by increases in trade accounts payable of $4.2 million, customer deposits of $2 million and other current liabilities of $500,000. For the year ended December 31, 2018 the net loss of $5.1 million was offset by non-cash adjustments totaling $3.4 million and the increases in current assets of $1.2 million were offset the increase in current liabilities of $1.3 million, so the net cash used in operating activities in 2018 was primarily related to the net loss.
29
Investing Activities
Net cash used in investing activities was approximately $2.8 million for the quarter ended March 31, 2020 and approximately $5.5 million for the quarter ended March 31, 2019. Investing activities in 2020 were primarily attributable to a store acquisition ($1.8 million) and vehicles and store equipment purchases ($652,000). Investing activities in for the quarter ended March 31, 2019 were primarily related to store acquisitions for which we paid approximately $5.0 million and the purchase of vehicles and store equipment to support new store operations of approximately $430,000.
Net cash used in investing activities was approximately $11.8 for the year ended December 31, 2019 and approximately $6.4 million for the year ended December 31, 2018. The increase in 2019 was due to the multiple asset acquisitions throughout 2019 and the purchase of vehicles and store equipment to support new store operations. During 2019, we opened or acquired ten new stores and as such we incurred expenditures for store racking and displays, vehicles and other store furniture and fixtures. During 2018, we opened or acquired nine new stores and as such we incurred expenditures for store racking and displays, vehicles and other store furniture and fixtures.
Financing Activities
Net cash provided by financing activities for the quarter ended March 31, 2020 was approximately $472,000 and was primarily attributable to proceeds from the exercise of warrants of approximately $510,000, offset by debt principal payments of approximately $38,000. Net cash used in financing activities for the quarter ended March 31, 2019 was $(98,000) and was primarily from proceeds from the exercise of warrants of $2,000, offset by debt principal payments of approximately $100,000.
Net cash provided by financing activities for the year ended December 31, 2019 was approximately $13 million and represented proceeds from the sale of our common stock and exercise of warrants, net of offering costs, of $13.9 million offset by payments of long-term debt of $460,000. Net cash provided by financing activities for the year ended December 31, 2018 was approximately $21.3 million and was comprised of proceeds from the sales of our common stock and exercise of warrants, net of offering costs of $12.9 million and proceeds from convertible debt of $8.9 million, net of payments of long-term debt of $455,000.
Financing Activities
2019 Private Placement
On June 26, 2019, we completed a private placement of a total of 4,123,257 units of the Company’s securities at the price of $3.10 per unit. Each unit consisted of (i) one share of Common Stock and (ii) one 3-year warrant, each entitling the holder to purchase one half share of Common Stock, at a price of $3.50 per share. The Company raised a total of $12,782,099 from 19 accredited investors.
2018 Private Placements
On January 17, 2018, we completed a private placement of a total of 36 units of our securities at the price of $250,000 per unit. Each unit consisted of (i) a 0.1% unsecured convertible promissory note in the principal amount of $250,000, and (ii) a 3-year warrant entitling the holder to purchase 37,500 shares of our common stock, at a price of $.01 per share or through cashless exercise. We raised gross proceeds of $9,000,000 from 23 accredited investors in the offering.
On May 9, 2018, we completed a private placement of a total of 33.33 units of its securities at a price of $300,000 per unit to 3 accredited investors. Each unit consisted of (i) 100,000 share of our common stock and (ii) 50,000 3-year warrant to purchase one share of common stock at an exercise price of $.35 per share. We raised an aggregate of $10,000,000 gross proceeds in the offering.
OFF-BALANCE SHEET ARRANGEMENTS
We do not have any off-balance sheet arrangements (as that term is defined in Item 303 of Regulation S-K) that are reasonably likely to have a current or future material effect on our financial condition, revenue or expenses, results of operations, liquidity, capital expenditures or capital resources.
30
Critical Accounting Policies, Judgments and Estimates
Use of Estimates
The preparation of these consolidated financial statements in conformity with accounting principles generally accepted in the United States (U.S. GAAP) requires management to make a number of estimates and assumptions related to the reported amount of assets and liabilities and the disclosure of contingent assets and liabilities at the date of the consolidated financial statements and the reported amounts of revenues and expenses during the period. Significant items subject to such estimates and assumptions include the carrying amount of intangible assets; valuation allowances and reserves for receivables, inventory and deferred income taxes; share-based compensation; and loss contingencies, including those related to litigation. Actual results could differ from those estimates.
Accounts Receivable and Concentration of Credit Risk
Accounts receivable are recorded at the invoiced amounts less an allowance for doubtful accounts and do not bear interest. The allowance for doubtful accounts is based on our estimate of the amount of probable credit losses in our accounts receivable. We determine the allowance for doubtful accounts based upon an aging of accounts receivable, historical experience and management judgment. Accounts receivable balances are reviewed individually for collectability, and balances are charged off against the allowance when we determine that the potential for recovery is remote. An allowance for doubtful accounts of approximately $291,372 has been reserved as of March 31, 2020 and December 31, 2019.
We are exposed to credit risk in the normal course of business, primarily related to accounts receivable. We are affected by general economic conditions in the United States. To limit credit risk, management periodically reviews and evaluates the financial condition of its customers and maintains an allowance for doubtful accounts. As of March 31, 2020, and December 31, 2019, we do not believe that we have significant credit risk.
Fair Value of Financial Instruments
The carrying amounts of our financial instruments, including accounts receivable and accounts payable, are carried at cost, which approximates their fair value due to their short-term maturities. We believe that the carrying value of notes payable with third parties, including their current portion, approximate their fair value, as those instruments carry market interest rates based on our current financial condition and liquidity.
Long-lived Assets
We evaluate the carrying value of long-lived assets for impairment on an annual basis or whenever events or changes in circumstances indicate that the carrying amounts may not be recoverable. An asset is considered to be impaired when the anticipated undiscounted future cash flows of an asset group are estimated to be less than its carrying value. The amount of impairment recognized is the difference between the carrying value of the asset group and its fair value. Fair value estimates are based on assumptions concerning the amount and timing of estimated future cash flows. No impairment was determined as of March 31, 2020 and December 31, 2019.
Revenue Recognition
Revenue on product sales is recognized upon delivery or shipment. Customer deposits and lay away sales are not reported as revenue until final payment is received and the merchandise has been delivery.
Stock-based Compensation
We account for stock-based awards at fair value on the date of grant and recognize compensation over the service period that they are expected to vest. We estimate the fair value of stock options and stock purchase warrants using the Black-Scholes option pricing model. The estimated value of the portion of a stock-based award that is ultimately expected to vest, taking into consideration estimated forfeitures, is recognized as expense over the requisite service periods. The estimate of stock awards that will ultimately vest requires judgment, and to the extent that actual forfeitures differ from estimated forfeitures, such differences are accounted for as a cumulative adjustment to compensation expenses and recorded in the period that estimates are revised.
31
RECENTLY ISSUED ACCOUNTING STANDARDS
Recently Adopted Accounting Pronouncements
During the first quarter of 2019, the Company adopted the Financial Accounting Standards Board (FASB) Accounting Standards Update (ASU) 2016-02, Leases (ASC 842), which introduces the balance sheet recognition of lease assets and lease liabilities by lessees for those leases classified as operating leases under previous guidance. The Company has adopted the new lease standard using the new transition option issued under the amendments in ASU 2018-11, Leases, which allowed the Company to continue to apply the legacy guidance in Accounting Standards Codification (ASC) 840, Leases, in the comparative periods presented in the year of adoption. The Company elected the package of practical expedients permitted under the transition guidance within the new standard, which among other things, allowed the Company to carry forward the historical lease classification. The Company made an accounting policy election to keep leases with an initial term of 12 months or less off the balance sheet. The Company will recognize those lease payments on a straight-line basis over the lease term. The impact of the adoption was an increase to the Company’s operating lease assets and liabilities on January 1, 2019 of $3.2 million.
On January 1, 2019, the Company also adopted ASU 2018-07, “Improvements to Nonemployee Share-Based Payment Accounting.” ASU 2018-07 more closely aligns the accounting for employee and nonemployee share-based payments. The amendment is effective commencing in 2019 with early adoption permitted. The adoption of this new guidance did not have a material impact on our Financial Statements.
In August 2018, the SEC adopted amendments to certain disclosure requirements in Securities Act Release No. 33-10532, Disclosure Update and Simplification. These amendments eliminate, modify, or integrate into other SEC requirements certain disclosure rules. Among the amendments is the requirement to present an analysis of changes in stockholders’ equity in the interim financial statements included in Quarterly Reports on Form 10-Q. The analysis, which can be presented as a footnote or separate statement, is required for the current and comparative quarter and year-to-date interim periods. The amendments are effective for all filings made on or after November 5, 2018. The Company adopted these amendments in its Quarterly Report on Form 10-Q for the quarter ended March 31, 2020.
In January 2016, the FASB issued ASU 2016-01, Financial Instruments-Overall: Recognition and Measurement of Financial Assets and Financial Liabilities, which requires that (i) all equity investments, other than equity-method investments, in unconsolidated entities generally be measured at fair value through earnings and (ii) when the fair value option has been elected for financial liabilities, changes in fair value due to instrument-specific credit risk will be recognized separately in other comprehensive income. Additionally, the ASU 2016-01 changes the disclosure requirements for financial instruments. The new standard was effective for the Company starting in the first quarter of fiscal 2019. The adoption of this standard on January 1, 2019 did not have any effect on the consolidated financial statements and footnote disclosure.
On August 28, 2017, the FASB issued ASU 2017-12, “Derivatives and Hedging,” which better aligns risk management activities and financial reporting for hedging relationships through changes to both the designation and measurement guidance for qualifying hedging relationships and the presentation of hedge results. The amendments expand and refine hedge accounting for both nonfinancial and financial risk components and in some situations better align the recognition and presentation of the effects of the hedging instrument and the hedged item in the financial statements. The new standard was effective for the Company as of January 1, 2019. The adoption of this new standard on January 1, 2019 did not have any impact on our consolidated financial statements and footnote disclosures.
Recently Issued Accounting Pronouncements – Pending Adoption
In June 2016, the FASB issued ASU 2016-13, Financial Instruments-Credit Losses: Measurement of Credit Losses on Financial Instruments, which changes the impairment model for most financial assets and certain other instruments. For trade receivables and other instruments, entities will be required to use a new forward-looking expected loss model that generally will result in the earlier recognition of allowances for losses. For available-for-sale debt securities with unrealized losses, the losses will be recognized as allowances rather than as reductions in the amortized cost of the securities. This guidance is effective for annual reporting periods beginning after December 15, 2019, including interim periods within those years, with early adoption permitted only as of annual reporting periods beginning after December 15, 2018. The Company is currently evaluating the impact of the adoption of this guidance on the Company’s consolidated financial statements.
In August 2018, the FASB issued ASU 2018-13, Fair Value Measurement (Topic 820): Disclosure Framework - Changes to the Disclosure Requirements for Fair Value Measurement. The new guidance modifies the disclosure requirements on fair value measurements in Topic 820. The amendments in ASU 2018-13 are effective for all entities for fiscal years, and interim periods within those fiscal years, beginning after December 15, 2019. The Company does not anticipate that the adoption of ASU 2018-13 will have a material impact on the Company’s consolidated financial statements or related financial statement disclosures.
32
Background
We believe we are the largest chain of stand-alone hydroponic garden centers by revenue and number of stores in the United States. We also believe we are a leading marketer and distributor of nutrients, growing media, advanced indoor and greenhouse lighting, ventilation systems and accessories for hydroponic gardening, based on the knowledge and estimate of management. We have a diverse customer base, with commercial customers (licensed growers) constituting the majority of our total sales. As of June 9, 2020, we own and operate a chain of 27 retail and commercial hydroponic/gardening centers in 10 U.S. states. We also operate an online e-commerce store, growgeneration.com. Our core strategy continues to focus on expanding our geographic reach across the United States through organic growth, in terms of increasing same store sales and expanding customer base, and acquisitions.
Our retail operations are driven by our high-quality products, value-add knowledgeable staff and fast distribution capabilities. As of June 9, 2020, we employ horticulturists that we have branded “Grow Pros”. Our operations span over 300,000 square feet of retail and warehouse space. During COVID-19, we have been deemed an “essential” supplier to the agricultural industry and, as such, we remain open and continue our operations. In the first quarter of 2020, our revenue was $33 million, which increased 152% from the same period of the prior year, and in 2019, our revenue was $80 million, which increased 175% compared to 2018.
We operate our business through the following sales channels:
| ● | Retail: 27 retail and commercial hydroponic/gardening centers focused on serving growers and cultivators. |
| ● | Commercial: Sales to commercial customers, including expert growers and cultivators, and provide them with advice from sales representatives with the requisite expertise (whom we brand as “GrowPros”) to serve their specific needs. |
| ● | E-Commerce: Our existing e-commerce operation, growgeneration.com (previously HeavyGarden.com and GrowGen.Pro), is currently being developed and rebranded into an omni-channel sales approach to enable e-commerce at all of our locations, which we intend to launch in late June 2020. |
| ● | Distribution: The majority of our stores are also functioning as warehouse, distribution and fulfillment centers for directing products to our store locations and to the retail, wholesale and mass hydroponic markets. |
Growth Strategy - Store Acquisitions and New Store Openings
Our growth strategy is to expand the number of our retail and commercial operations throughout the United States. The hydroponic retail landscape is fragmented, which we believe has allowed us to acquire the “best of breed” locations in the United States. In addition, the company has a 2-year roadmap to open a number of new locations in underserved markets throughout the country. In addition to the 10 states where we are currently operating, we have identified Arizona, Illinois, Pennsylvania, New York, New Jersey and Missouri as new markets where we plan to open a new operation. In 2019, we opened and acquired ten locations and in the first quarter of 2020, we opened a second hydroponic/gardening center in Tulsa, Oklahoma, a 40,000 square feet store operation and fulfillment center, and acquired Healthy Harvest located outside of Miami, FL.
33
Products and Private Label Strategy
We sell a variety of products, including nutrients, growing media, advanced indoor and greenhouse lighting, ventilation systems, and accessories for hydroponic gardening, as well as other indoor and outdoor growing products. Our supply chain includes several thousand stock keeping units (“SKUs”) across 12 product departments. Many of our products are consumables leading to repeat orders by our customers. Consumable products are mainly nutrients and additives that feed the plants on a recurring basis. Our strategy is to supply products to two groups of customers: commercial growers and smaller growers that require a local center to fulfill their daily and weekly growing needs.
We are also actively developing a line of private label products that we intend to sell through our garden centers under brands we own or control. Our strategy is to deliver high-quality products at a lower cost, and higher margin to us. To further our private label strategy, we acquired various trademarks in March 2019 to aid in branding our ‘in house’ products to our customers. We introduced our first private labeled products under the Sunleaves brand in first quarter of 2020. This initial offering encompassed a broad variety of products ranging from trellis netting to plastic pots and organic nutrients. We expect to introduce additional private label products during 2020 and 2021. We believe that expanding our private label offerings will have a positive impact on our margins and profitability in the near term.
34
Markets
Our stores sell thousands of products, including nutrients, growing media, advanced indoor and greenhouse lighting, ventilation systems, and accessories for hydroponic gardening, as well as other indoor and outdoor growing products, that serve multi-purposes and are designed and intended for growing a wide range of plants. Hydroponics is a specialized method of growing plants using mineral nutrient solutions in a water solvent, as opposed to soil. This method is typically used inside greenhouses to give growers the ability to better regulate and control nutrient delivery, light, air, water, humidity, pests, and temperature. Hydroponic growers benefit from these techniques by producing crops faster and with higher crop yields per acre as compared to traditional soil-based growers. Indoor growing techniques and hydroponic products are being utilized in new and emerging industries or segments, including the growing of cannabis and hemp. In addition, vertical farms producing organic fruits and vegetables are also beginning to utilize hydroponics due to a rising shortage of farmland as well as environmental vulnerabilities including drought, other severe weather conditions and insect pests.
According to a report by Markets and Markets on the hydroponics market, the global hydroponics system market is estimated to grow from an estimated $8 billion in 2019 to approximately $16 billion by 2025, at a compound annual growth rate of approximately 12%. In the U.S. hydroponics market, the legalization of cannabis for medicinal and non-medicinal use and increased number of licensed cultivation facilities are driving demand for hydroponic products. Currently there are comprehensive, publicly available medical marijuana/cannabis programs in 33 states and the District of Columbia, including 11 states that also permit recreational sales to adults. We believe that the growth in licensed cultivation facilities and the increase in organically grown produce will increase the demand for hydroponics products generally. Further, the current landscape for retail stores focusing on selling hydroponic garden products is very fragmented and presents opportunities for consolidation.
We have a diverse customer base, with commercial customers constituting the majority of our total sales. We cater to commercial and home cultivators growing specialty crops, including growing cannabis and hemp, along with organic herbs and leafy green vegetables. We believe that commercial growers choose to source their hydroponic gardening supplies from us because we understand their specific needs and employ sales representatives with the requisite expertise (whom we brand as “GrowPros”) to serve expert growers and cultivators by helping them reduce any potential challenges in utilizing hydroponic products to grow their crops. Based on our customer profile, we believe that we are well positioned to benefit from growth of the overall hydroponic market. In addition, we believe that the highly fragmented hydroponics retail market and numerous single store operators presents us with a significant opportunity to execute our roll-up strategy to expand and deepen our geographic footprint.
Research and Development
We have not incurred any research and development expense during the fiscal years ended December 31, 2019 and 2018.
Customers and Suppliers
Our key customers vary by state and are expected to be more defined as we move from our retail walk-in purchasing sales strategy to serving cultivation facilities directly, which we expect will result in predictable purchasing activity. We have a diverse customer base, with commercial customers constituting the majority of our total sales. We cater to commercial and home cultivators growing specialty crops, including growing cannabis and hemp, along with organic herbs and leafy green vegetables. Currently, none of our customers accounted for more than 5% of our sales in the years ended December 31, 2019 and 2018.
In 2019, we created a commercial division with a dedicated sales and support team to sell and service large commercial customers, who are primarily licensed growers of medicinal and non-medicinal cannabis. As of the first quarter of 2020, our commercial division services over 500 commercial accounts, who collectively contributed approximately $17 million in revenue or approximately 20% of our sales in 2019. We have identified over 14,000 licensed hemp and cannabis growers in the United States, and believe there is significant room for us to expand our base of commercial customers.
Our key suppliers include several manufacturers and distributors such as FoxFarm Fertilizer, Canna, USA Mills Nutrients, Hawthorne Garden Supply, Hydrofarm, and others. All the products purchased and sold are applicable to indoor and outdoor growing for organics, greens, and plant-based medicines. As of December 31, 2019 and 2018, two suppliers represented 51% and 56% of our purchases, respectively. We are of the opinion that the loss of either supplier would not have a material adverse impact on our business, because both suppliers provide the same products and we maintain direct manufacturing agreements with vendors.
35
E-Commerce Strategy
We are currently developing and rebranding our existing e-commerce operation, HeavyGarden.com and GrowGen.Pro, as growgeneration.com, which will be an omni-channel sales approach to enable e-commerce at all of our locations, providing our customers convenient ways to shop when and how they feel comfortable. We intend to launch this strategy in late June 2020. This omni-channel approach will provide 24/7 availability of products and allow our customers to “Buy Online and Pick Up In Store.” Customers will be able to shop online in all product departments and access descriptions, reviews and pictures of our products. Our customers can order online and they can choose to either have their products delivered directly to their growing facility (usually within 48 hours) or they can pick up the products at one of our stores (usually within 24 hours). We believe that this omni-channel initiative will result in a more seamless, convenient shopping experience for our customers and will drive financial results.
Distribution Channel
We have built a supply chain that currently spans through 27 locations across 10 states. We are in the process of building several 20,000+ square feet store operations that will serve as fulfillment service centers, in addition to serving the local retail and commercial customers. These stores and fulfillment centers will ship directly to a farm or home as well as to any commercial hydroponic store (including ours and others) in the United States. We have a fleet of trucks that allow us to deliver within the proximity of any of these locations.
Seasonality
We do not have any material seasonal impacts.
Competition
The markets in which we sell our products are highly competitive. Our key competitors include many local and national vendors of gardening supplies, local product resellers of hydroponic and other specialty growing equipment, as well as online product resellers and large online marketplaces such as Amazon.com and eBay. Our industry is a highly fragmented industry with over 1,000 retail outlets throughout the U.S. We compete with companies that have greater capital resources, facilities and diversity of product lines. Our competitors may also introduce new hydroponic growing equipment, manufacturers may sell equipment direct to consumers, and our distributers could cease sales of product to us.
Notwithstanding the foregoing, we believe that our pricing, inventory and product availability and overall customer service provide us with the ability to compete in this marketplace. We believe that we have the following core competitive advantages over our competitors:
| ● | We offer a one-stop shopping experience to all types of growers by providing “selection, service, and solutions”; |
| ● | We provide end-to-end solutions for our commercial customers from capex built-out to consumables to nourish their plants; |
| ● | We have a knowledge-based sales team, all with horticultural experience; |
| ● | We offer the options to transact online, in store, or buy online and pick up; |
| ● | We consider ourselves to be a leader of the products we offer, from launching new technologies to the development of our private label products; and |
| ● | We have a professional team for mergers and acquisitions to acquire and open new locations and successfully add them to our company portfolio. |
In addition, as we increase our number of stores and inventory per store, we expect to be able to purchase larger amounts of inventory at lower volume sale prices, which we expect will enable us to price competitively and deliver the products that our customers are seeking. We compete on supply chain competency, field sales support, in-store sales support, the strength of our relationships with major manufacturers, distributors and advertising.
Based on our knowledge and communication with our suppliers, we do not believe our suppliers sell directly to the retail market or our customers.
36
Intellectual Property and Proprietary Rights
Our intellectual property consists of our brands and their related trademarks, domain names and websites, customer lists and affiliations, product know-how and technology, and marketing intangibles. We also hold rights to website addresses related to our business including www.growgeneration.com which we actively use in our day-to-day business. A list of the trademarks we owned are as follows: Blueprint Controllers, Carbide, DuraBreeze, Elemental Solutions, GrowGeneration, GrowXcess, GuardenWare, Harvester’s Edge, HeavyGardens, Ion, MixSure+, OptiLUME, Power Matrix, Smart Support, Sunleaves, Sunspot, The Fountain for Automation, VitaPlant, and Where The Pros Go To Grow. We have trademark applications pending in the United States for GROWGEN, GROWGENERATION, GROWGENERATION Design, HYDROTHRIVE, and CHUBBY BUDDHA; and we also have trademark applications pending in Canada for GROWGEN, GROWGENERATION, and GROWGENERATION Design.
Government Regulation
We sell products, including hydroponic gardening products, that end users may purchase for use in new and emerging industries or segments, including the growing of cannabis and hemp, that may not grow or achieve market acceptance in a manner that we can predict. The demand for these products depends on the uncertain growth of these industries or segments.
In addition, we sell products that end users may purchase for use in industries or segments, including the growing of cannabis and hemp, that are subject to varying, inconsistent, and rapidly changing laws, regulations, administrative practices, enforcement approaches, judicial interpretations and consumer perceptions. For example, certain countries and 33 U.S. states have adopted frameworks that authorize, regulate, and tax the cultivation, processing, sale, and use of cannabis for medicinal and/or non-medicinal use, while the U.S. Controlled Substances Act and the laws of other U.S. states prohibit growing cannabis. In addition, with the passage of the Farm Bill in December 2018, hemp cultivation is now broadly permitted. The Farm Bill explicitly allows the transfer of hemp-derived products across state lines for commercial or other purposes. It also puts no restrictions on the sale, transport, or possession of hemp-derived products, so long as those items are produced in a manner consistent with the law. We believe the recent passage of the 2018 Farm Bill will allow the Company to expand its marketplace opportunities.
Our gardening products, including our hydroponic gardening products, are multi-purpose products designed and intended for growing a wide range of plants and are purchased by cultivators who may grow any variety of plants, including cannabis and hemp. Although the demand for our products may be negatively impacted depending on how laws, regulations, administrative practices, enforcement approaches, judicial interpretations, and consumer perceptions develop, we cannot reasonably predict the nature of such developments or the effect, if any, that such developments could have on our business.
Employees
As of June 9, 2020, we have 254 total employees, 215 of which are full-time employees and 39 of which are part-time employees. No employees are subject to collective bargaining agreements.
Properties
Our principal offices are located at 930 W 7th Ave, Suite A, Denver, CO 80204. As of December 31, 2019, we leased six (6) facilities in the State of Colorado, eight (8) in the State of California, one (1) in the State of Nevada, one (1) in the State of Washington, one (1) in the State of Oregon, one (1) in the State of Rhode Island, four (4) in the State of Oklahoma, four (4) in the State of Michigan, three (3) in the State of Maine, two (2) in the State of Florida, all for our corporate and retail operations. In total the Company leases approximately 357,900 square feet of space, which consists primarily of 6,900 feet of corporate office space, 104,000 square feet of warehouse space and 247,000 square feet of store space.
37
Executive Officers and Directors
All directors hold office for one-year terms until the election and qualification of their successors. Officers are appointed by our Board and serve at the discretion of the board, subject to applicable employment agreements. The following table sets forth information regarding our executive officers and the members of our Board.
| Name | Age | Position | ||
| Darren Lampert | 59 | Chief Executive Officer and Director | ||
| Michael Salaman | 58 | President and Director | ||
| Tony Sullivan | 55 | Chief Operating Officer, Executive VP | ||
| Monty Lamirato | 64 | Chief Financial Officer and Secretary | ||
| Stephen Aiello | 59 | Director | ||
| Sean Stiefel | 32 | Director | ||
| Paul Ciasullo | 61 | Director |
Darren Lampert has been our Chief Executive Officer and a Director since our inception in 2014. Mr. Lampert began his career in 1986 as a founding member of the law firm of Lampert and Lampert (1986-1999), where he concentrated on securities litigation, NASD (now FINRA) compliance and arbitration and corporate finance matters. Mr. Lampert has represented clients in actions and investigations brought before government agencies and self-regulatory bodies. Mr. Lampert has spent 15 years working as a portfolio manager and proprietary trader at Schonfeld Securities (1999-2005), Schottenfeld Group (2007) and Incremental Capital (2008-2010). From 2010 to 2014, Mr. Lampert was a private investor. Mr. Lampert graduated in 1982 with a Bachelor of Science degree in business administration from Ithaca College. Mr. Lampert received a JD from Bridgeport University School of Law in 1985. Mr. Lampert was admitted to practice law in New York in 1986 and is also admitted to practice before the United States District Courts for the Southern and Eastern Districts of New York.
Michael Salaman has been our President and a Director since our inception. Mr. Salaman served as the Chairman of Skinny Nutritional Corp. from January 2002 to March 2014 and as Chief Executive Officer and President of Skinny Nutritional Corp. from June 2010 to March 2014. He also served as Chief Executive Officer of Skinny Nutritional Corp. Skinny Nutritional Corp. filed for Chapter 11 Bankruptcy protection in 2013 and the assets were sold to a private equity firm in March 2014. Mr. Salaman has over 20 years’ experience in the area of start-ups, new product development, distribution and marketing. Mr. Salaman began his business career as Vice President of Business Development for National Media Corp., an infomercial marketing company in the United States from 1985-1993. From 1995-2001, Mr. Salaman started a Digital Media company called American Interactive Media, Inc., a developer of Web TV set-top boxes and ISP services. In 2002, Mr. Salaman became the principal officer of that entity and directed its operations as a marketing and distribution company and in 2005 focused its efforts in the enhanced water business. Mr. Salaman received a Bachelor of Business Administration degree in business from Temple University in 1986.
Tony Sullivan joined the Company as Chief Operating Officer and Executive Vice President in November 2019. His initiatives include, but are not limited to, providing support to all GrowGeneration stores; adding new locations; integrating our e-commerce, commercial and store supply channels; designing, building and implementing our company strategy, business strategies, plans and procedures; setting comprehensive goals for business growth and success; developing, standardizing and deliver critical key performance indicators, metrics and business acumen across organization. From 2017 to recently, Mr. Sullivan served as Executive Vice President and Chief Operating Officer of Forman Mills, a $300 million Private Equity sponsored business. From 2015 to 2017, he was Senior Vice President Operations for Dollar Express, a $500 million carve-out of 330 Family Dollar stores in 36 states, Private Equity sponsored business. From 2006 to 2015, he was employed at Anna’s Linens for 9+ years where he served in several operating roles, most recently as SVP, Chief Operating Officer. Previously Mr. Sullivan served for 20+ years at Foot Locker Inc. leading 2,100 + stores, 3 Divisions (Foot Locker, Kids Foot Locker and Foot Action) over $2.5B in sales as VP Store Operations. Mr. Sullivan is known and respected for his expertise in wide-range governance, hypergrowth, and macro-level strategic management methodologies, with an emphasis on identifying and addressing business infrastructure to position organizations for expansion and profitability. He has achieved outstanding success scaling businesses for rapid profits and market dominance in start-ups, private, PE-backed, and public companies with revenues up to $2.5 billion.
Monty Lamirato joined the Company as Chief Financial Officer and Secretary in May 2017. From March 2009 to just prior to joining GrowGen, Mr. Lamirato worked as an independent consultant providing chief financial officer and financial reporting consulting services to companies of various sizes in a variety of industries. In this capacity, he prepared and reviewed SEC filings and GAAP-compliant financial statements, provided technical accounting assistance, designed and developed inventory and logistics systems for inventory management, developed scalable accounting and reporting systems, internal accounting controls and annual budgets and evaluated short-term investment alternatives for idle cash. From March 2013 until November 2016, Mr. Lamirato served as Chief Financial Officer of Strategic Environmental & Energy Resources, Inc., a publicly traded holding company that provides a wide range of environmental, renewable fuels and industrial waste stream management services, where he was responsible for all SEC filings, prepared all GAAP and SEC compliant financial statements and developed financial and operating metrics and other key performance indicators for evaluation of business results by management. Mr. Lamirato has also served as Chief Financial Officer and Treasurer of ARC Group Worldwide, Inc. from June 2001 to March 2009, Vice President of Finance at GS2.net, LLC from November 2000 to May 2001, and also Vice President of Finance for PlanetOutdoors.com, Inc. from June 1999 to October 2000. He began his career as an audit staff member with Coopers & Lybrand in 1977, where he remained until he served as an Audit Manager and Audit Partner with Mitchell Finley and Company, P.C. from 1986 to 1993. Mr. Lamirato received a Bachelor of Science, cum laude, from Regis College in Denver and is a Certified Public Accountant.
38
Stephen Aiello has been a Director of the Company since May 2014. Mr. Aiello was a partner at Jones and Company from 2004-2008. From 2001-2003, he worked at 033 Asset Management. From 1986-2001, he was a partner at Montgomery Securities. Mr. Aiello received a B.A. in Psychology from Ithaca College and an MBA from Fordham University. Since 2010, Mr. Aiello has been a private investor and owner of real estate properties.
Sean Stiefel has been a Director of the Company since January 2018. Mr. Stiefel founded Navy Capital LLC in 2014, where he is currently a Portfolio Manager and is responsible for all aspects of stock selection, investment due diligence and portfolio construction. Mr. Stiefel launched the Navy Capital Green Fund, LP in 2017 as a global public equity focused cannabis dedicated fund. Navy Capital has been involved in cannabis related investing since early 2016. Prior to founding Navy Capital, Mr. Stiefel was a research analyst and trader for Northwoods Capital Management Partners, a global equity fund with a fundamental value and special situations investment strategy. Mr. Stiefel had previously served as an associate within an equity long/short fund at Millennium Partners, and he began his career as an equities trading analyst for Barclays Capital. He is a graduate of the University of Southern California’s Marshall School of Business.
Paul Ciasullo has been a Director of the Company since May 2020 and a board member of Leafline Labs, LLC since 2018, which is a provider, manufacturer and distributor of medical cannabis in Minnesota. In 2010, Mr. Ciasullo founded Wallstreet Research Solutions, LLC, which provided sales, marketing and customer account services primarily in partnership with and to build a fixed income research firm specializing in bond and loan covenants called Covenant Review, LLC (with which he had been working to build the business since 2007). Covenant Review and Wallstreet Research Solutions merged and later re-branded as Fulcrum Financial Data LLC and Mr. Ciasullo acted as President of Global Marketing and Sales and was a board member from 2014 to 2018 when the company was sold to Fitch Ratings Services. While working with Covenant Review, Mr. Ciasullo built a sales force in the U.S. and London including assimilation of the purchase of a UK company Capital Structure Ltd where he was also on the Board. From 2005 to 2006, Mr. Ciasullo was a Managing Director at Soleil Securities Group Inc., responsible for developing a strategy for bringing alternative research such as industry knowledge into a stock research environment. In 2000, Mr. Ciasullo was a founder of and acted as President of CreditSights, Inc., an institutional investment research firm specializing in fixed income research for institutional investors where, until 2004, he built a global salesforce after overseeing the design and build of the original website which was amongst the first in the industry to deliver research over the internet. Prior to that, Mr. Ciasullo held a number of Managing Director positions as head of trading at large brokerage firms. Mr. Ciasullo graduated from Brown University in 1981 with a Bachelor of Arts in Economics and International Relations.
Involvement in Certain Legal Proceedings
To our knowledge, during the past ten years, none of our directors, executive officers, promoters, control persons, or nominees other than Michael Salaman (see biographical information of Michael Salaman above regarding the Chapter 11 Bankruptcy protection filed by Skinny Nutritional Corp. in 2013) has:
| ● | had any bankruptcy petition filed by or against the business or property of the person, or of any partnership, corporation or business association of which he was a general partner or executive officer, either at the time of the bankruptcy filing or within two years prior to that time; |
| ● | been convicted in a criminal proceeding or been subject to a pending criminal proceeding (excluding traffic violations and other minor offenses); |
| ● | been subject to any order, judgment, or decree, not subsequently reversed, suspended or vacated, of any court of competent jurisdiction or federal or state authority, permanently or temporarily enjoining, barring, suspending or otherwise limiting, his involvement in any type of business, securities, futures, commodities, investment, banking, savings and loan, or insurance activities, or to be associated with persons engaged in any such activity; |
| ● | been found by a court of competent jurisdiction in a civil action or by the SEC or the Commodity Futures Trading Commission to have violated a federal or state securities or commodities law, and the judgment has not been reversed, suspended, or vacated; |
| ● | been the subject of, or a party to, any federal or state judicial or administrative order, judgment, decree, or finding, not subsequently reversed, suspended or vacated (not including any settlement of a civil proceeding among private litigants), relating to an alleged violation of any federal or state securities or commodities law or regulation, any law or regulation respecting financial institutions or insurance companies including, but not limited to, a temporary or permanent injunction, order of disgorgement or restitution, civil money penalty or temporary or permanent cease-and-desist order, or removal or prohibition order, or any law or regulation prohibiting mail or wire fraud or fraud in connection with any business entity; or |
| ● | been the subject of, or a party to, any sanction or order, not subsequently reversed, suspended or vacated, of any self-regulatory organization (as defined in Section 3(a)(26) of the Exchange Act), any registered entity (as defined in Section 1(a)(29) of the Commodity Exchange Act), or any equivalent exchange, association, entity or organization that has disciplinary authority over its members or persons associated with a member. |
39
Board Committees
Audit Committee
The Company’s Audit Committee is comprised of, Stephen Aiello (Chairman), Sean Stiefel and Paul Ciasullo. The Board has determined that all of Messrs. Aiello, Stiefel and Ciasullo are independent directors. Mr. Aiello qualifies as an “audit committee financial expert” within the meaning of the rules of the SEC. The Board has adopted an Audit Committee Charter, which was filed as Exhibit 99.1 to the Company’s Annual Report on Form 10-K for year ended December 31, 2019 (“2019 10-K”).
The purpose of the Audit Committee is to perform and to assist the Board of Directors in fulfilling its oversight responsibility relating to (i) the Company’s financial statements and financial reporting process and the Company’s systems of internal accounting and financial controls; (ii) the integrity of the Company’s financial statements; (iii) the appointment, retention and performance of the internal auditors, if applicable; (iv) the annual independent audit of the Company’s financial statements, the engagement of the independent auditors and the evaluation of the independent auditors’ qualifications, independence and performance; (v) the compliance by the Company with legal and regulatory requirements, including the Company’s disclosure controls and procedures; and (vi) the evaluation of management’s process to assess and manage the Company’s enterprise risk issues.
Compensation Committee
The Company’s Compensation Committee is comprised of Stephen Aiello and Paul Ciasullo. The Board has adopted a Compensation Committee Charter, which was filed as Exhibit 99.2 to the 2019 10-K.
The purpose of the Compensation Committee is to review, determine and approve all forms of compensation to be provided to the Company’s executive officers and any equity compensation to be provided to all employees, and monitor the performance of the Company’s executive officers.
Nominating and Corporate Governance Committee
The Company’s Nominating and Corporate Governance Committee is comprised of Stephen Aiello and Paul Ciasullo. The Board has adopted a Nominating and Corporate Governance Committee Charter, which was filed as Exhibit 99.3 to the 2019 10-K.
The purpose of the Nominating and Corporate Governance Committee is to (i) oversee all aspects of the Company’s corporate governance functions on behalf of the Board; (ii) make recommendations to the Board of Directors regarding corporate governance issues; (iii) identify, review and evaluate candidates to serve as directors of the Company consistent with criteria approved by the Board of Directors and review and evaluate incumbent directors; (iv) serve as a focal point for communication between such candidates, non-committee directors and the Company’s management; (v) select or recommend to the Board of Directors for selection candidates to the Board of Directors to serve as nominees for director for the annual meeting of stockholders; and (vi) make other recommendations to the Board of Directors regarding affairs relating to the directors of the Company, including director compensation.
Code of Business Conduct and Ethics
The Company has adopted a Code of Business Conduct and Ethics, which was filed as Exhibit 14.1 to the 2019 10-K.
Insider Trading Policy
The Company has adopted an Insider Trading Policy which sets forth the procedure regarding trading by insiders in securities of the Company.
Limitation of Directors Liability and Indemnification
The Colorado Business Corporations Act authorizes corporations to limit or eliminate, subject to certain conditions, the personal liability of directors to corporations and their stockholders for monetary damages for breach of their fiduciary duties.
The Amended and Restated Bylaws of the Company provide that the Company will indemnify its directors and officers who, by reason of the fact that he or she is one of the Company’s officers or directors, is involved in a legal proceeding of any nature.
40
The Company has purchased director and officer liability insurance to cover certain liabilities its directors and officers may incur in connection with their services to the Company.
There is no pending litigation or proceeding involving any of our directors, officers, employees or agents in which indemnification will be required or permitted.
The Company is not aware of any threatened litigation or proceeding that may result in a claim for such indemnification.
Indemnification Agreements
The employment agreements the Company entered into with each of its current executive officers provides for indemnification to the fullest extent permitted by applicable law for the executive officers against all debts, judgments, costs, charges or expenses whatsoever incurred or sustained by an executive officer in connection with any action, suit or proceeding to which the executive officer may be made a party by reason of his being or having been an officer of the Company, or because of actions taken by the executive officer which were believed by the executive officer to be in the best interests of the Company.
EXECUTIVE AND DIRECTOR COMPENSATION
Summary Compensation Table
The following table presents information regarding the total compensation awarded to, earned by, or paid to our chief executive officer and the three most highly-compensated executive officers (other than the chief executive officer) who were serving as executive officers as of December 31, 2019 for services rendered in all capacities to us for the years ended December 31, 2019 and 2018.
| Name and Principal Position | Year | Salary ($) | Bonus ($) | Option Awards ($)(1) | Stock Based Awards ($)(2) | Total ($) | ||||||||||||||||
| Darren Lampert | 2019 | 211,750 | 358,765 | 1,147,700 | 1,224,000 | 2,914,215 | ||||||||||||||||
| Chief Executive Officer | 2018 | 192,500 | 105,000 | 58,000 | - | 355,500 | ||||||||||||||||
| Michael Salaman | 2019 | 211,750 | 358,765 | 1,147,700 | 1,224,000 | 2,914,215 | ||||||||||||||||
| President | 2018 | 192,500 | 105,000 | 58,000 | - | 355,500 | ||||||||||||||||
| Monty Lamirato (3) | 2019 | 175,000 | 30,750 | 389,100 | 373,500 | 968,350 | ||||||||||||||||
| Chief Financial Officer and Secretary | 2018 | 162,500 | - | 46,600 | - | 209,100 | ||||||||||||||||
| Tony Sullivan (4) | 2019 | 45,000 | - | 726,300 | 498,000 | 1,269,300 | ||||||||||||||||
| Chief Operating Officer | ||||||||||||||||||||||
| Joe Prinzivalli (4) | 2019 | 127,400 | - | - | - | 127,400 | ||||||||||||||||
| Chief Operating Officer | 2018 | 110,000 | - | 23,300 | - | 133,300 | ||||||||||||||||
| (1) | The amounts in the Option Awards column reflect the aggregated grant date fair value of awards granted during 2019 and 2018 as computed in accordance with FASB ASC Topic 718. |
| (2) | The amounts in the Stock Based Awards column reflect the aggregated grant date fair value of awards granted during 2019 and 2018 as computed in accordance with FASB ASC Topic 718. |
| (3) | As of May 15, 2017, Monty Lamirato started to provide his services to the Company as Chief Financial Officer and Secretary. |
| (4) | Effective November 4, 2019 Mr. Tony Sullivan was appointed Chief Operating Officer and Executive Vice President and Mr. Joe Prinzivalli resigned as Chief Operating Officer. |
41
Employment Agreements
On September 22, 2017, the Company entered into employment agreements with Darren Lampert, Chief Executive Officer, and Michael Salaman, President, who have each agreed to devote their full time and attention to the Company’s business and each receive compensation of $175,000 per annum, subject to a 10% increase each January 1 during the term of the agreements. In addition, commencing with the year ending December 31, 2017, each of Mr. Lampert and Mr. Salaman is entitled to receive a cash bonus payment equal to 0.5% multiplied by the difference between revenue in each fiscal year less $7,980,471, and is granted up to 300,000 options to purchase shares of common stock of the Company, of which 30,750 have been granted as of the date of their respective agreements.
On June 21, 2019, the Board of Directors approved the terms of new three-year employment agreements, effective January 1, 2020, with Darren Lampert, Chief Executive Officer, and Michael Salaman, President. On March 23, 2020, the Company entered into three-year executive employment agreements with each of Mr. Lampert and Mr. Salaman, respectively, pursuant to which the Company agreed to pay each of them a salary of $275,000 per annum, subject to a 10% increase each January 1 during the term of the agreements. In addition, commencing with the year ending December 31, 2020, each of Mr. Lampert and Mr. Salaman is eligible for a cash bonus payment equal to 0.5% multiplied by the difference between revenue in each fiscal year less $79,773,568. The Company also agreed to (i) issue each of them a total of 300,000 shares of common stock in three equal installments each year; and (ii) grant each of them 300,000 options to purchase shares of Common Stock of the Company with a three year vesting schedule with 100,000 options vested as of January 1, 2020, 100,000 options as of January 1, 2021 and 100,000 options as of January 1, 2022. In addition, Mr. Lampert and Mr. Salaman each received a one-time signing bonus of 100,000 shares of common stock as of January 1, 2020.
On May 15, 2017, the Company entered into a three-year executive employment agreement with Monty Lamirato as Chief Financial Officer and Secretary, pursuant to which the Company agreed to pay Mr. Lamirato a salary of $150,000 per annum for the first year, $162,500 for the second year and $175,000 for the third year. The Company also agreed to issue to Mr. Lamirato 25,000 shares of common stock and 50,000 stock options as of July 10, 2017, May 15, 2018 and May 15, 2019, respectively.
On November 5, 2019, the Company entered into a new three-year executive employment agreement, effective January 1, 2020, with Monty Lamirato as Chief Financial Officer and Secretary, pursuant to which the Company agreed to pay Mr. Lamirato a salary of $205,000 per annum for the first year, $225,000 for the second year and $250,000 for the third year. The Company also agreed to issue to Mr. Lamirato a total of 90,000 shares of Common Stock in three equal installments each year and grant a total of 150,000 stock options with 50,000 options vesting on January 1, 2020, January 1, 2021 and January 1, 2022.
On November 4, 2019, the Company entered into a three-year executive employment agreement with Tony Sullivan as Chief Operating Officer and Executive Vice President, pursuant to which the Company agreed to pay Mr. Sullivan a salary of $270,000 per annum, subject to a 10% increase each year on the anniversary date of this agreement. In addition, the Company agreed to pay Mr. Sullivan a bonus with respect to each fiscal year in an amount equal to a minimum of $75,000. The Company also agreed to issue to Mr. Sullivan a total of 120,000 shares of Common Stock in three equal installments each year and grant a total of 280,000 stock options with 160,000 vested on November 4, 2019, 60,000 on November 4, 2020 and 60,000 on November 4, 2021. Mr. Sullivan was also paid a relocation fee of up to $80,000.
Additionally, each member of management may receive a year-end cash bonus and options as determined by the Compensation Committee and the Board.
42
Outstanding Equity Awards
The following table summarizes, for each of the named executive officers, the number of shares of common stock underlying outstanding stock options held as of December 31, 2019.
| Option Awards | Stock Awards | |||||||||||||||||||||||||||||||||
| Name | Number of securities underlying unexercised options (#) exercisable | Number of securities underlying unexercised options (#) unexercisable | Equity incentive plan awards: Number of securities underlying unexercised unearned options (#) | Option exercise price ($) | Option expiration date | Number of shares or units of stock that have not vested (#) | Market value of shares of units of stock that have not vested ($) | Equity incentive plan awards: Number of unearned shares, units or other rights that have not vested (#) | Equity incentive plan awards: Market or payout value of unearned shares, units or other rights that have not vested ($) | |||||||||||||||||||||||||
| Darren Lampert | 133,335 | 0 | $ | 1.76 | September 22, 2022 | - | - | - | - | |||||||||||||||||||||||||
| Darren Lampert | 16,667 | 8,333 | $ | 3.59 | October 23, 2023 | - | - | - | - | |||||||||||||||||||||||||
| Darren Lampert | 33,333 | 16,667 | $ | 2.96 | March 25, 2024 | - | - | - | - | |||||||||||||||||||||||||
| Darren Lampert | 0 | 300,000 | $ | 4.10 | June 19, 2024 | 400,000 | $ | 1,640,000 | - | - | ||||||||||||||||||||||||
| Michael Salaman | 133,335 | 0 | $ | 1.76 | September 22, 2022 | - | - | - | - | |||||||||||||||||||||||||
| Michael Salaman | 16,667 | 8,333 | $ | 3.59 | October 23, 2023 | - | - | - | - | |||||||||||||||||||||||||
| Michael Salaman | 33,333 | 16,667 | $ | 2.96 | March 25, 2024 | - | - | - | - | |||||||||||||||||||||||||
| Michael Salaman | 0 | 300,000 | $ | 4.10 | June 19, 2024 | 400,000 | $ | 1,640,000 | - | - | ||||||||||||||||||||||||
| Monty Lamirato | 50,000 | 100,000 | $ | 4.12 | November 4, 2024 | 90,000 | $ | 369,000 | - | - | ||||||||||||||||||||||||
| Tony Sullivan | 160,000 | 120,000 | $ | 3.52 | November 3, 2024 | 80,000 | $ | 328,000 | - | - | ||||||||||||||||||||||||
Director Compensation
The following table details the compensation paid to or accrued for each of the Company’s non-management directors in the year ended December 31, 2019:
| Fees Earned or Paid in Cash (1) | Stock Awards | Option Awards | Non-Equity Incentive Plan Compensation | Change in Pension Value and Nonqualified Deferred Compensation Earnings | All Other Compensation | Total | ||||||||||||||||||||||
| Name | ($) | ($) | ($) | ($) | ($) | ($) | ($) | |||||||||||||||||||||
| Stephen Aiello | -0- | -0- | 97,000 | -0- | -0- | -0- | 97,000 | |||||||||||||||||||||
| Peter Rosenberg (2) | -0- | -0- | 97,000 | -0- | -0- | -0- | 97,000 | |||||||||||||||||||||
| Sean Stiefel | -0- | -0- | 97,000 | -0- | -0- | -0- | 97,000 | |||||||||||||||||||||
| (1) | During the year ended December 31, 2019, directors did not receive any cash compensation for serving on the Board of the Company. |
| (2) | Mr. Rosenberg served on the Board until May 11, 2020. |
2014 Equity Incentive Plan
On March 6, 2014, our Board adopted an Equity Incentive Plan (the “2014 Plan”). The 2014 Plan was approved by the shareholders on March 6, 2014. As of June 9, 2020, there are a total of 2,113,834 options issued under the 2014 Plan (of which 1,718,334 options have been exercised and 224,000 remain outstanding), and 375,000 shares of Common Stock issued. There are a total of 11,166 shares of Common Stock available to be issued under the 2014 Plan.
43
Amended and Restated 2018 Equity Incentive Plan
On January 7, 2018, the Board adopted the 2018 Equity Incentive Plan, which was approved and ratified by the shareholders on April 20, 2018. On February 7, 2020, the Board approved the amendment and restatement of the 2018 Plan to increase the number of shares issuable thereunder from 2,500,000 to 5,000,000, which amendment was approved by shareholders on May 11, 2020 (as amended and restated, the “Amended 2018 Plan”). As of June 9, 2020, there have been a total of (i) 1,899,000 options issued (of which 1,843,500 options are currently outstanding, 43,833 have been exercised, and 11,667 have been forfeited which will be available for future grants), and (ii) 690,833 shares of Common Stock issued. There are a total of 2,421,834 shares of Common Stock available to be issued under the 2018 Plan.
The general purpose of the Amended 2018 Plan is to provide an incentive to the Company’s employees, directors, consultants and advisors by enabling them to share in the future growth of the Company’s business. The Board believes that the granting of stock options, restricted stock awards, unrestricted stock awards and similar kinds of equity-based compensation promotes continuity of management and increases incentive and personal interest in the welfare of the Company by those who are primarily responsible for shaping and carrying out its long range plans and securing its growth and financial success.
The Board believes that the Amended 2018 Plan will advance the Company’s interests by enhancing its ability to (a) attract and retain employees, consultants, directors and advisors who are in a position to make significant contributions to the Company’s success; (b) reward the Company’s employees, consultants, directors and advisors for these contributions; and (c) encourage employees, consultants, directors and advisors to take into account the Company’s long-term interests through ownership of its shares.
Description of the Amended and Restated 2018 Equity Incentive Plan
The following description of the principal terms of the Amended 2018 Plan is a summary and is qualified in its entirety by the full text of the Amended 2018 Plan, which was filed as an exhibit to the Proxy Statement on Schedule 14A filed on March 27, 2020.
Administration. The Amended 2018 Plan will be administered by our Board. Our Board may grant options to purchase shares of our common stock, stock appreciation rights, restricted stock units, restricted or unrestricted shares of our common stock, performance shares, performance units, other cash-based awards and other stock-based awards. The Board also has broad authority to determine the terms and conditions of each option or other kind of equity award, adopt, amend and rescind rules and regulations for the administration of the Amended 2018 Plan and amend or modify outstanding options, grants and awards.
Eligibility. Persons eligible to receive awards under the Amended 2018 Plan are employees, directors and consultants of our Company and our subsidiaries. As of June 9, 2020, approximately 254 employees, three non-employee directors, and approximately six consultants are eligible to participate in the Amended 2018 Plan. The Board may at any time and from time to time grant awards under the Amended 2018 Plan to eligible persons on a discretionary basis.
Shares Subject to the Amended 2018 Plan. The aggregate number of shares of common stock available for issuance in connection with options and awards granted under the Amended 2018 Plan is 5,000,000, subject to customary adjustments for stock splits, stock dividends or similar transactions. Incentive Stock Options may be granted under the Amended 2018 Plan with respect to all of those shares. If any option or stock appreciation right granted under the Amended 2018 Plan terminates without having been exercised in full or if any award is forfeited, or if shares of common stock are withheld to cover withholding taxes on options or other awards, the number of shares of common stock as to which such option or award was forfeited, or which were withheld, will be available for future grants under the Amended 2018 Plan. The maximum aggregate number of shares of common stock with respect to one or more awards that may be granted to any employee, director or consultant during any calendar year shall be 1,000,000 and the maximum aggregate amount of cash that may be paid in cash during any calendar year with respect to one or more awards payable in cash shall be $600,000.
Terms and Conditions of Options. Options granted under the Amended 2018 Plan may be either “incentive stock options” that are intended to meet the requirements of Section 422 of the Code or “nonstatutory stock options” that do not meet the requirements of Section 422 of the Code. Incentive stock options may be granted only to employees. Each option grant will be evidenced by an award agreement that will specify the terms and conditions as determined by the Board. The Board will determine the exercise price of options granted under the 204 Plan. The exercise price of stock options may not be less than the fair market value, on the date of grant, per share of our common stock issuable upon exercise of the option (or 110% of fair market value in the case of incentive options granted to a ten-percent stockholder).
If on the date of grant the common stock is listed on a stock exchange or a national market system, the fair market value shall be the closing sale price on the last trading day before the date of grant. If no such prices are available, the fair market value shall be determined in good faith by the Board based upon the advice of a qualified valuation expert.
No option may be exercisable for more than ten years (five years in the case of an incentive stock option granted to a ten-percent stockholder) from the date of grant. Options granted under the Amended 2018 Plan will be exercisable at such time or times as the Board prescribes at the time of grant. No employee may receive incentive stock options that first become exercisable in any calendar year in an amount exceeding $100,000.
Generally, the option price may be paid (a) in cash or by bank check, (b) through delivery of shares of our common stock having a fair market value equal to the purchase price, (c) through cashless exercise, or (d) a combination of these methods.
44
No option may be transferred other than by will or by the laws of descent and distribution, and during a recipient’s lifetime an option may be exercised only by the recipient. Options granted under the 2018 Plan will be exercisable at such time or times as the Board prescribes at the time of grant. No employee may receive incentive stock options that first become exercisable in any calendar year in an amount exceeding $100,000.
The following table sets forth stock options that were approved by the Board to the persons and groups named below under the Amended 2018 Plan as of December 31, 2019.
| Name and Position | Number of Shares of Common Stock underlying Stock Options | |||
| Darren Lampert, Chief Executive Officer | 375,000 | |||
| Michael Salaman, President | 375,000 | |||
| Monty Lamirato, Chief Financial Officer | 170,000 | |||
| Tony Sullivan, Chief Operating Officer | 280,000 | |||
| All executive officers as a group | 1,180,000 | |||
| All non-executive directors as a group | 225,000 | |||
| All non-executive officer employees as a group | 217,333 | |||
Stock Appreciation Rights. The Board may grant stock appreciation rights under the Amended 2018 Plan in such amounts as the Board in its sole discretion will determine. Each stock appreciation right grant will be evidenced by an award agreement that will specify the terms and conditions as determined by the Board. The exercise price per share of a stock appreciation right will be determined by the Board, but will not be less than 100% of the fair market value of a share of our common stock on the date of grant. The maximum term of any SAR granted under the Amended 2018 Plan is ten years from the date of grant. Generally, each SAR stock appreciation right will entitle a participant upon exercise to an amount equal to:
| ● | the excess of the fair market value on the exercise date of one share of our common stock over the exercise price, multiplied by | |
| ● | the number of shares of common stock covered by the stock appreciation right. |
Payment may be made in shares of our common stock, in cash, or partly in common stock and partly in cash, all as determined by the Board.
Restricted Stock and Restricted Stock Units. The Board may award restricted common stock and/or restricted stock units under the Amended 2018 Plan in such amounts as the Board in its sole discretion will determine. The Board will determine the restrictions and conditions applicable to each award of restricted stock or restricted stock units, as evidenced in an award agreement, which may include performance-based conditions. Dividends and other distributions with respect to restricted stock may be paid to the holder of the shares as and when dividends are paid to stockholders, unless otherwise provided in the award agreement. Unless the Board determines otherwise, holders of restricted stock will have the right to vote the shares.
Performance Shares and Performance Units. The Board may award performance shares and/or performance units under the Amended 2018 Plan in such amounts as the Board in its sole discretion will determine. Each performance unit will have an initial value that is established by the Board on or before the date of grant. Each performance share will have an initial value equal to the fair market value of a share on the date of grant. The Board at its discretion will set performance objectives or other vesting provisions. The Board will determine the restrictions and conditions applicable to each award of performance shares and performance units, as evidenced in an award agreement.
Effect of Certain Corporate Transactions. In the event of a change in control (as defined in the Amended 2018 Plan), the Board has the discretion and without the need for the consent of any recipient of an award to take the following actions as to an outstanding award: (i) awards will be assumed, or substantially equivalent awards will be substituted, by the acquiring or succeeding corporation; (ii) awards will terminate upon or immediately prior to the consummation of such change in control; (iii) outstanding awards will vest and become exercisable, or restrictions applicable to an award will lapse, in whole or in part prior to or upon consummation of such change in control, and terminate upon or immediately prior to the effectiveness of such change in control; (iv) an award is terminated in exchange for an amount of cash and/or property, if any, equal to the amount that would have been attained upon the exercise of such award; (v) an award is replaced with other rights or property selected by the Board in its sole discretion; or (vi) any combination of the foregoing.
45
Amendment, Termination. The Board may at any time amend, alter, amend the terms of awards in any manner not inconsistent with the Amended 2018 Plan, provided that no amendment shall adversely affect the rights of a participant with respect to an outstanding award without the participant’s consent. In addition, our Board may at any time amend, suspend, or terminate the Amended 2018 Plan, provided that (i) no such amendment, suspension or termination shall materially and adversely affect the rights of any participant under any outstanding award without the consent of such participant and (ii) to the extent necessary to comply with any applicable law or stock exchange rule, the Company will obtain stockholder consent of amendment to the plan.
Tax Withholding
Prior to the delivery of any shares or cash pursuant to an award or exercise thereof, the Company will have the power and the right to deduct or withhold, or require a holder of such award to remit to the Company, an amount sufficient to satisfy federal, state, local, foreign or other taxes required to be withheld with respect to such award or exercise thereof.
Grants of Awards
The grant of awards under the Amended 2018 Plan is discretionary, and the Company cannot determine now the specific number or type of options or awards to be granted in the future to any particular person or group.
Equity Compensation Plan Information
The following table provides certain information with respect to all of our equity compensation plans in effect as of the fiscal year ended December 31, 2019.
| Number of common shares to be issued upon exercise of outstanding options, warrants and rights (a) | Weighted-average exercise price of outstanding option, warrants and rights (b) | Number of common shares remaining available for future issuance under equity compensation plans (excluding shares reflected in column (a)) (c) | ||||||||||
| Equity compensation plans approved by security holders | ||||||||||||
| 2014 Equity Compensation Plan | 224,000 | $ | 2.03 | 11,166 | ||||||||
| 2018 Equity Compensation Plan | 1,698,5003 | $ | 3.26 | 692,917 | ||||||||
| Equity compensation plans not approved by security holders | — | $ | — | — | ||||||||
| Total | 1,922,500 | $ | 3.33 | 704,083 | ||||||||
The following table sets forth the number of shares of common stock beneficially owned as of June 9, 2020 by:
| ● | each of our stockholders who is known by us to beneficially own 5% or more of our common stock; | |
| ● | each of our executive officers; | |
| ● | each of our directors; and | |
| ● | all of our directors and current executive officers as a group. |
Beneficial ownership is determined based on the rules and regulations of the SEC. A person has beneficial ownership of shares if such individual has the power to vote and/or dispose of shares. This power may be sole or shared and direct or indirect. Applicable percentage ownership in the following table is based on the total of 38,713,338 shares of common stock outstanding as of June 9, 2020. In computing the number of shares beneficially owned by a person and the percentage ownership of that person, shares of common stock that are subject to options or warrants held by that person and exercisable as of, or within 60 days of, the date of this Prospectus. These shares, however, are not counted as outstanding for the purposes of computing the percentage ownership of any other person(s). Except as may be indicated in the footnotes to this table and pursuant to applicable community property laws, each person named in the table has sole voting and dispositive power with respect to the shares of common stock set forth opposite that person’s name. Unless indicated below, the address of each individual listed below is c/o GrowGeneration Corp., 930 W 7th Ave, Suite A, Denver, CO 80204.
46
| Name of Beneficial Owner | Number of Shares Beneficially Owned | Percentage of Shares Beneficially Owned | ||||||
| Michael Salaman, President and Director | 1,664,836 | 1 | 4.27 | % | ||||
| Darren Lampert, Chief Executive Officer and Director | 1,615,249 | 2 | 4.14 | % | ||||
| Tony Sullivan, Executive Vice President and Chief Operating Officer | 200,000 | 3 | * | |||||
| Monty Lamirato, Chief Financial Officer and Secretary | 153,987 | 4 | * | |||||
| Stephen Aiello, Director | 510,809 | 5 | 1.32 | % | ||||
| Paul Ciasullo, Director | 416,666 | 6 | 1.08 | % | ||||
| Sean Stiefel, Director | 1,464,104 | 7 | 3.73 | % | ||||
| All Officers and Directors (7 Persons) | 6,125,651 | 15.03 | % | |||||
| Merida Capital Partners, LP | 4,992,438 | 8 | 12.48 | % | ||||
| Gotham Green Fund 1, L.P. | 4,551,531 | 9 | 11.56 | % | ||||
| * | Less than 1% |
| 1 | Includes i) 1,381,501 shares of common stock; and ii) 283,335 vested stock options. Mr. Salaman also has 8,333 options exercisable commencing October 23, 2020, 16,667 options exercisable on March 26, 2021, 100,000 options exercisable on January 1, 2021 and 100,000 options exercisable on January 1, 2022. |
| 2 | Includes i) 1,331,914 shares of common stock; and ii) 283,335 vested stock options. Mr. Lampert also has 8,333 options exercisable commencing October 23, 2020, 16,667 options exercisable on March 26, 2021, 100,000 options exercisable on January 1, 2021 and 100,000 options exercisable on January 1, 2022. |
| 3 | Includes i) 40,000 shares of common stock; and ii) 160,000 vested options. Mr. Sullivan also has 60,000 options exercisable beginning November 3, 2020 and 60,000 options exercisable beginning November 3, 2021. |
| 4 | Includes i) 103,987 shares of common stock and ii) 50,000 vested stock options. Mr. Lamirato also has 50,000 options exercisable commencing January 1, 2021 and 50,000 options exercisable commencing January 1, 2022. |
| 5 | Includes i) 269,143 shares of common stock owned directly by Mr. Aiello; ii) 150,000 shares of common stock owned by Aiello Family Trust; iii) 91,666 vested stock options; Mr. Aiello also owns 8,333 options exercisable commencing October 23, 2020, 16,667 options exercisable commencing March 26, 2021, 16,667 options exercisable commencing May 12, 2021 and 16,667 options exercisable commencing May 12, 2022.. |
| 6 | Includes i) 400,000 shares of common stock; and ii) 16,666 vested stock options. Mr. Ciasullo also has 16,667 options exercisable commencing May 12, 2021 and 16,667 options exercisable commencing May 12, 2022. |
| 7 | Includes (i) 116,666 vested stock options; (ii) 279,570 shares of common stock underlying warrants held by Navy Capital Green Fund, LP; (iii) 96,774 shares of common stock underlying warrants held by Navy Capital Green Co-Invest Fund LP; (iv) 777,546 shares of common stock held by Navy Capital Green Fund LP; and (v) 193,548 shares of common stock held by Navy Capital Green Co-Invest Fund LP. Mr. Stiefel is a founder and Chief Executive Officer of Navy Capital. Accordingly, Mr. Stiefel may be deemed to indirectly beneficially own the shares held by Navy Capital and its affiliated entities, and vice versa. Mr. Stiefel also has 8,333 options exercisable commencing October 23, 2020, 16,667 options exercisable commencing March 26, 2021, 16,667 options exercisable commencing May 12, 2021 and 16,667 options exercisable commencing May 12, 2022. |
| 8 | Includes (i) 2,338,029 shares of common stock held by Merida Capital Partners, LP; (ii) 872,957 shares of common stock held by Merida Capital Partners II LP; (iii) 483,871 shares of common stock held by Merida Capital Partners III LP; and (iv) 1,297,581 shares of common stock underlying warrants held by Merida and its affiliates. The address of Merida Capital Partners, LP is 641 Lexington Avenue, 18th Floor, New York, NY 10022. |
| 9 | Includes (i) 522,262 shares of common stock held by Gotham Green Fund 1, L.P.; (ii) 2,093,385 shares of common stock held by Gotham Green Fund 1 (Q), L.P.; (iii) 1,101,135 shares of common stock held by Gotham Green Fund II (Q), L.P.; (iv) 189,187 shares of common stock held by Gotham Green Fund II, L.P.; (v) 550,568 shares of common stock underlying warrants held by Gotham Green Fund II (Q), L.P.; and vi) 94,594 shares of common stock underlying warrants held by Gotham Green Fund II, L.P. The address of Gotham Green Fund 1, L.P. is 1437 4th Street, Santa Monica, CA 90401. |
47
CERTAIN RELATIONSHIPS AND RELATED PARTY TRANSACTIONS
Unless described below, during the last two fiscal years, there are no transactions or series of similar transactions to which we were a party or will be a party, in which:
| ● | the amounts involved exceeded or will exceed $120,000; and | |
| ● | any of our directors, executive officers or holders of more than 5% of our capital stock, or any member of the immediate family of the foregoing persons, had or will have a direct or indirect material interest. |
Our current Certificate of Incorporation authorizes us to issue:
| ● | 100,000,000 shares of common stock, par value $0.001 per share. |
As of June 9, 2020, there were 38,713,338 shares of common stock outstanding. The number of shares of common stock outstanding as of June 9, 2020 does not include: (i) a total of 3,151,079 shares of our common stock issuable upon exercise of warrants; and (ii) a total of 2,334,170 shares of our common stock issuable upon exercise of options.
The following statements are summaries only of the material provisions of our authorized capital stock and are qualified in their entirety by reference to our Certificate of Incorporation and our Amended and Restated Bylaws, which is filed as an exhibit to the registration statement of which this prospectus forms a part.
Common Stock
Voting. The holders of our common stock are entitled to one vote for each share held of record on all matters on which the holders are entitled to vote (or consent to).
Dividends. The holders of our common stock are entitled to receive, ratably, dividends only if, when and as declared by our Board out of funds legally available therefor and after provision is made for each class of capital stock having preference over the common stock (including the common stock).
Liquidation Rights. In the event of our liquidation, dissolution or winding-up, the holders of our common stock are entitled to share, ratably, in all assets remaining available for distribution after payment of all liabilities and after provision is made for each class of capital stock having preference over the common stock (including the common stock).
Conversion Rights. The holders of our common stock have no conversion rights.
Preemptive and Similar Rights. The holders of our common stock have no preemptive or similar rights.
Redemption/Put Rights. There are no redemption or sinking fund provisions applicable to the common stock. All of the outstanding shares of our common stock are fully-paid and nonassessable.
Transfer Restrictions. Shares of our common stock are subject to transfer restrictions. See “Restrictions on the Transfer of Securities.”
Warrants
As of June 9, 2020, we had outstanding warrants to purchase an aggregate of 3,151,079 shares of common stock.
Options
As of June 9, 2020, we had outstanding options to purchase 2,334,170 shares of our common stock (out of which a total of 1,389,174 are currently vested).
Transfer Agent and Registrar
VStock Transfer, LLC is the transfer agent and registrar for our common stock.
Listing of Securities
Our common stock is presently traded on the Nasdaq Capital Market under the ticker symbol of “GRWG”.
48
MATERIAL UNITED STATES FEDERAL INCOME
TAX CONSEQUENCES
TO NON-U.S. HOLDERS OF OUR COMMON STOCK
The following is a summary of the material U.S. federal income tax consequences to non-U.S. holders (as defined below) of the acquisition, ownership and disposition of our common stock issued pursuant to this offering. This discussion is not a complete analysis of all potential U.S. federal income tax consequences relating thereto, and does not address any estate or gift tax consequences or any tax consequences arising under any state, local or foreign tax laws, or any other U.S. federal tax laws. This discussion is based on the Internal Revenue Code of 1986, as amended, or the Code, and applicable Treasury Regulations promulgated thereunder, judicial decisions and published rulings and administrative pronouncements of the Internal Revenue Service, or IRS, all as in effect as of the date hereof. These authorities are subject to differing interpretations and may change, possibly retroactively, resulting in U.S. federal income tax consequences different from those discussed below. We have not requested a ruling from the IRS with respect to the statements made and the conclusions reached in the following summary, and there can be no assurance that the IRS or a court will agree with such statements and conclusions.
This discussion is limited to non-U.S. holders who purchase our common stock pursuant to this offering and who hold our common stock as a “capital asset” within the meaning of Section 1221 of the Code (generally, property held for investment). This discussion does not address all of the U.S. federal income tax consequences that may be relevant to a particular holder in light of such holder’s particular circumstances. This discussion also does not consider any specific facts or circumstances that may be relevant to holders subject to special rules under the U.S. federal income tax laws, including:
| ● | certain former citizens or long-term residents of the United States; | |
| ● | partnerships or other pass-through entities (and investors therein); | |
| ● | “controlled foreign corporations;” | |
| ● | “passive foreign investment companies;” | |
| ● | corporations that accumulate earnings to avoid U.S. federal income tax; | |
| ● | banks, financial institutions, investment funds, insurance companies, brokers, dealers or traders in securities; | |
| ● | tax-exempt organizations and governmental organizations; | |
| ● | tax-qualified retirement plans; | |
| ● | persons subject to the alternative minimum tax; | |
| ● | persons that own, or have owned, actually or constructively, more than 5% of our common stock; | |
| ● | accrual-method taxpayers subject to special tax accounting rules under Section 451(b) of the Code; | |
| ● | persons who have elected to mark securities to market; | |
| ● | persons who hold or receive our common stock pursuant to the exercise of any option or otherwise as compensation; | |
| ● | “qualified foreign pension funds” as defined in Section 897(l)(2) of the Code and entities all of the interests of which are held by qualified foreign pension funds; and | |
| ● | persons holding our common stock as part of a hedging or conversion transaction or straddle, or a constructive sale, or other risk reduction strategy or integrated investment. |
If an entity or arrangement that is classified as a partnership for U.S. federal income tax purposes holds our common stock, the U.S. federal income tax treatment of a partner in the partnership will generally depend on the status of the partner and the activities of the partnership. Partnerships holding our common stock and the partners in such partnerships are urged to consult their tax advisors about the particular U.S. federal income tax consequences to them of holding and disposing of our common stock.
49
THIS DISCUSSION IS FOR INFORMATIONAL PURPOSES ONLY AND IS NOT TAX ADVICE. PROSPECTIVE INVESTORS SHOULD CONSULT THEIR TAX ADVISORS REGARDING THE PARTICULAR U.S. FEDERAL INCOME TAX CONSEQUENCES TO THEM OF ACQUIRING, OWNING AND DISPOSING OF OUR COMMON STOCK, AS WELL AS ANY TAX CONSEQUENCES ARISING UNDER ANY STATE, LOCAL OR FOREIGN TAX LAWS AND ANY OTHER U.S. FEDERAL TAX LAWS. YOU SHOULD ALSO CONSULT WITH YOUR TAX ADVISOR WITH RESPECT TO SUCH CHANGES IN U.S. TAX LAW AS WELL AS POTENTIAL CONFORMING CHANGES IN STATE TAX LAWS.
Definition of Non-U.S. Holder
For purposes of this discussion, a non-U.S. holder is any beneficial owner of our common stock that is not a “U.S. person” or a partnership (including any entity or arrangement treated as a partnership) for U.S. federal income tax purposes. A U.S. person is any person that, for U.S. federal income tax purposes, is or is treated as any of the following:
| ● | an individual who is a citizen or resident of the United States; | |
| ● | a corporation (or entity treated as a corporation for U.S. federal income tax purposes) created or organized under the laws of the United States, any state thereof or the District of Columbia; | |
| ● | an estate, the income of which is subject to U.S. federal income tax regardless of its source; or | |
| ● | a trust (1) whose administration is subject to the primary supervision of a U.S. court and which has one or more U.S. persons who have the authority to control all substantial decisions of the trust or (2) that has a valid election in effect under applicable Treasury Regulations to be treated as a U.S. person. |
Distributions on Our Common Stock
As described under the section titled “Dividend Policy,” we have not paid and do not anticipate paying dividends. However, if we make cash or other property distributions on our common stock, such distributions will constitute dividends for U.S. federal income tax purposes to the extent paid from our current or accumulated earnings and profits, as determined under U.S. federal income tax principles. Amounts not treated as dividends for U.S. federal income tax purposes will constitute a return of capital and will first be applied against and reduce a non-U.S. holder’s tax basis in our common stock, but not below zero. Any excess will be treated as gain realized on the sale or other disposition of our common stock and will be treated as described under the section titled “Gain on Disposition of Our Common Stock” below.
Subject to the discussions below regarding effectively connected income, backup withholding and Sections 1471 through 1474 of the Code (commonly referred to as FATCA), dividends paid to a non-U.S. holder of our common stock generally will be subject to U.S. federal withholding tax at a rate of 30% of the gross amount of the dividends or such lower rate specified by an applicable income tax treaty. To receive the benefit of a reduced treaty rate, a non-U.S. holder must furnish us or our paying agent with a valid IRS Form W-8BEN or IRS Form W-8BEN-E (or applicable successor form) and satisfy applicable certification and other requirements. This certification must be provided to us or our paying agent before the payment of dividends and must be updated periodically. If the non-U.S. holder holds the stock through a financial institution or other agent acting on the non-U.S. holder’s behalf, the non-U.S. holder will be required to provide appropriate documentation to the agent, which then will be required to provide certification to us or our paying agent, either directly or through other intermediaries.
If a non-U.S. holder holds our common stock in connection with the conduct of a trade or business in the United States, and dividends paid on our common stock are effectively connected with such holder’s U.S. trade or business (and are attributable to such holder’s permanent establishment in the United States if required by an applicable tax treaty), the non-U.S. holder will be exempt from U.S. federal withholding tax. To claim the exemption, the non-U.S. holder must generally furnish a valid IRS Form W-8ECI (or applicable successor form) to the applicable withholding agent.
50
However, any such effectively connected dividends paid on our common stock generally will be subject to U.S. federal income tax on a net income basis at the regular U.S. federal income tax rates in the same manner as if such holder were a resident of the United States. A non-U.S. holder that is a foreign corporation also may be subject to an additional branch profits tax equal to 30% (or such lower rate specified by an applicable income tax treaty) of its effectively connected earnings and profits for the taxable year, as adjusted for certain items. Non-U.S. holders should consult their tax advisors regarding any applicable income tax treaties that may provide for different rules.
Non-U.S. holders that do not provide the required certification on a timely basis, but that qualify for a reduced treaty rate, may obtain a refund of any excess amounts withheld by timely filing an appropriate claim for refund with the IRS.
Gain on Disposition of Our Common Stock
Subject to the discussions below regarding backup withholding and FATCA, a non-U.S. holder generally will not be subject to U.S. federal income tax on any gain realized on the sale or other disposition of our common stock, unless:
| ● | the gain is effectively connected with the non-U.S. holder’s conduct of a trade or business in the United States, and if required by an applicable income tax treaty, is attributable to a permanent establishment maintained by the non-U.S. holder in the United States; | |
| ● | the non-U.S. holder is a nonresident alien individual present in the United States for 183 days or more during the taxable year of the disposition, and certain other requirements are met; or | |
| ● | our common stock constitutes a “United States real property interest” by reason of our status as a United States real property holding corporation, or USRPHC, for U.S. federal income tax purposes at any time within the shorter of the five-year period preceding the disposition or the non-U.S. holder’s holding period for our common stock, and our common stock is not regularly traded on an established securities market during the calendar year in which the sale or other disposition occurs. |
If we are a USRPHC and either our common stock is not regularly traded on an established securities market or a non-U.S. holder holds, or is treated as holding, more than 5% of our outstanding common stock, directly or indirectly, during the applicable testing period, gain described in the third bullet point above will generally be taxed in the same manner as gain that is effectively connected with the conduct of a U.S. trade or business, except that the branch profits tax generally will not apply. Determining whether we are a USRPHC depends on the fair market value of our U.S. real property interests relative to the fair market value of our other trade or business assets and our foreign real property interests. We believe that we are not currently and do not anticipate becoming a USRPHC for U.S. federal income tax purposes, although there can be no assurance we will not in the future become a USRPHC. If we are a USRPHC and our common stock is not regularly traded on an established securities market, a non-U.S. holder’s proceeds received on the disposition of shares will also generally be subject to withholding at a rate of 15%. Prospective investors are encouraged to consult their own tax advisors regarding the possible consequences to them if we are, or were to become, a USRPHC.
Gain described in the first bullet point above generally will be subject to U.S. federal income tax on a net income basis at the regular U.S. federal income tax rates in the same manner as if such holder were a resident of the United States. A non-U.S. holder that is a foreign corporation also may be subject to an additional branch profits tax equal to 30% (or such lower rate specified by an applicable income tax treaty) of its effectively connected earnings and profits for the taxable year, as adjusted for certain items.
Gain described in the second bullet point above will be subject to U.S. federal income tax at a flat 30% rate (or such lower rate specified by an applicable income tax treaty), but may be offset by certain U.S.-source capital losses (even though the individual is not considered a resident of the United States), provided that the non-U.S. holder has timely filed U.S. federal income tax returns with respect to such losses. Non-U.S. holders should consult their tax advisors regarding any applicable income tax treaties that may provide for different rules.
51
Information Reporting and Backup Withholding
Annual reports are required to be filed with the IRS and provided to each non-U.S. holder indicating the amount of dividends on our common stock paid to such holder and the amount of any tax withheld with respect to those dividends. These information reporting requirements apply even if no withholding was required because the dividends were effectively connected with the holder’s conduct of a U.S. trade or business, or withholding was reduced or eliminated by an applicable income tax treaty. This information also may be made available under a specific treaty or agreement with the tax authorities in the country in which the non-U.S. holder resides or is established. Backup withholding, currently at a 24% rate, generally will not apply to payments to a non-U.S. holder of dividends on or the gross proceeds of a disposition of our common stock provided the non-U.S. holder furnishes the required certification for its non-U.S. status, such as by providing a valid IRS Form W-8BEN, IRS Form W-8BEN-E or IRS Form W-8ECI, or certain other requirements are met. Backup withholding may apply if the payor has actual knowledge, or reason to know, that the holder is a U.S. person who is not an exempt recipient.
Backup withholding is not an additional tax. If any amount is withheld under the backup withholding rules, the non-U.S. holder should consult with a U.S. tax advisor regarding the possibility of and procedure for obtaining a refund or a credit against the non-U.S. holder’s U.S. federal income tax liability, if any.
Withholding on Foreign Entities
FATCA imposes a U.S. federal withholding tax of 30% on certain payments made to a “foreign financial institution” (as specially defined under these rules) unless such institution enters into an agreement with the U.S. government to withhold on certain payments and to collect and provide to the U.S. tax authorities substantial information regarding certain U.S. account holders of such institution (which includes certain equity and debt holders of such institution, as well as certain account holders that are foreign entities with U.S. owners) or an exemption applies. FATCA also generally will impose a U.S. federal withholding tax of 30% on certain payments made to a non-financial foreign entity unless such entity provides the withholding agent a certification identifying certain direct and indirect U.S. owners of the entity or an exemption applies. An intergovernmental agreement between the United States and an applicable foreign country may modify these requirements. Under certain circumstances, a non-U.S. holder might be eligible for refunds or credits of such taxes. FATCA currently applies to dividends paid on our common stock. Under applicable Treasury Regulations and administrative guidance, withholding under FATCA would have applied to payments of gross proceeds from the sale or other disposition of stock on or after January 1, 2019, but under proposed regulations (the preamble to which specifies that taxpayers are permitted to rely on such proposed regulations pending finalization), no withholding would apply with respect to payments of gross proceeds.
Prospective investors are encouraged to consult with their own tax advisors regarding the possible implications of this legislation on their investment in our common stock.
We entered into an underwriting agreement with the underwriters named below on , 2020. Oppenheimer & Co. Inc. is acting as the sole book-running manager and representative of the underwriters, and Ladenburg Thalmann & Co. Inc. and Lake Street Capital Markets, LLC are acting as co-managers. The underwriting agreement provides for the purchase of a specific number of shares of common stock by each of the underwriters. The underwriters’ obligations are several, which means that each underwriter is required to purchase a specified number of shares of common stock, but is not responsible for the commitment of any other underwriter to purchase shares of common stock. Subject to the terms and conditions of the underwriting agreement, each underwriter has severally agreed to purchase the number of shares of common stock set forth opposite its name below:
| Number of | |||
| Underwriter | Shares of Common Stock | ||
| Oppenheimer & Co. Inc. | |||
| Ladenburg Thalmann & Co. Inc. | |||
| Lake Street Capital Markets, LLC | |||
| Total |
Subject to the terms and conditions set forth in the underwriting agreement, the underwriters have agreed to purchase all of the shares offered by this prospectus (other than those covered by the option described below), if any are purchased.
The shares of common stock offered hereby are expected to be ready for delivery on or about , 2020 against payment in immediately available funds.
The underwriters are offering the shares of common stock subject to various conditions and may reject all or part of any order. The representative of the underwriters has advised us that the underwriters propose initially to offer the shares of common stock to the public at the public offering price set forth on the cover page of this prospectus and to dealers at a price less a concession not in excess of $ per share of common stock to brokers and dealers. After the shares of common stock are released for sale to the public, the representative may change the offering price, the concession, and other selling terms at various times.
52
We have granted the underwriters an option to purchase additional shares for the purpose of covering over-allotments. This option, which is exercisable for up to 30 days after the date of this prospectus, permits the underwriters to purchase a maximum of additional shares of common stock from us. If the underwriters exercise all or part of this option, they will purchase shares of common stock covered by the option at the public offering price that appears on the cover page of this prospectus, less the underwriting discounts and commissions. The underwriters have severally agreed that, to the extent the option is exercised, they will each purchase a number of additional shares proportionate to such underwriter’s initial amount reflected in the foregoing table. If this option is exercised in full, the total price to public will be $ , and the total proceeds to us, before expenses, will be $ million.
The following table provides information regarding the amount of the discounts and commissions to be paid to the underwriters by us, before expenses:
| Per Share of Common Stock | Total Without Exercise of Underwriters’ Option | Total With Full Exercise of Underwriters’ Option | ||||||||||
| Public offering price | $ | $ | $ | |||||||||
| Underwriting discounts and commissions(1) | $ | $ | $ | |||||||||
| Proceeds, before expenses, to us | $ | $ | $ | |||||||||
| (1) | We have agreed to pay the underwriters a commission of 6% of the gross proceeds of this offering. |
We estimate that our total expenses of the offering, excluding the estimated underwriting discounts and commissions, will be approximately $ . We have agreed to reimburse the underwriters for all reasonable out-of-pocket costs and expenses incident to the performance of the obligations of the representative under the underwriting agreement (including, without limitation, the fees and expenses of the underwriters’ outside attorneys).
We have agreed to indemnify the underwriters against certain liabilities, including liabilities under the Securities Act of 1933, as amended.
We have agreed to a 90-day “lock-up,” during which, without the prior written consent of Oppenheimer & Co. Inc., we shall not issue, sell or register with the Securities and Exchange Commission (the “SEC”) (other than on Form S-8 or on any successor form) with respect to any of our equity securities (or any securities convertible into, exercisable for or exchangeable for any of our equity securities), except for (i) the issuance of the shares of common stock offered pursuant to this prospectus; (ii) the issuance of shares of common stock or securities convertible into or exercisable or exchangeable for shares of common stock, to an unaffiliated third-party on an arm’s-length basis, representing in the aggregate no more than 10% of our issued and outstanding shares of common stock as of the date of this prospectus, which may be issued only in connection with the acquisition of a business or assets, as long as recipients of such securities agree to be bound by a lock-up agreement; and (iii) the issuance of shares of common stock pursuant to our existing stock option or bonus plan as described in the registration statement of which this prospectus forms a part.
Our executive officers, directors and certain of our significant stockholders have also agreed to a 90-day “lock-up,” during which, without the prior written consent of Oppenheimer & Co. Inc., they shall not, directly or indirectly, (i) offer, pledge, assign, encumber, announce the intention to sell, sell, contract to sell, sell any option or contract to purchase, purchase any option or contract to sell, grant any option, right or warrant to purchase, or otherwise transfer or dispose of, any shares of common stock or any securities convertible into or exercisable or exchangeable for common stock, owned either of record or beneficially (as defined in the Securities Exchange Act of 1934, as amended (the “Exchange Act”) by any signatory of the lock-up agreement on the date of the prospectus or thereafter acquired; (ii) enter into any swap or other agreement that transfers, in whole or in part, any of the economic consequences of ownership of the common stock or any securities convertible into or exercisable or exchangeable for common stock, whether any such transaction described in clauses (i) or (ii) above is to be settled by delivery of common stock or such other securities, in cash or otherwise, or publicly announce an intention to do any of the foregoing; and (iii) make any demand for or exercise any right with respect to, the registration of any shares of common stock or any security convertible into or exercisable or exchangeable for common stock. The foregoing shall not apply to (i) common stock to be transferred as a gift or gifts (provided, that (a) any donee shall execute and deliver to Oppenheimer & Co. Inc., acting on behalf of the underwriters, not later than one business day prior to such transfer, a lock-up agreement to Oppenheimer & Co. Inc. and (b) if the lock-up signatory is required to file a report under Section 16(a) of the Exchange Act, reporting a reduction in beneficial ownership of shares of common stock or beneficially owned shares or any securities convertible into or exercisable or exchangeable for common stock or beneficially owned shares during the 90-day “lock-up,” the lock-up signatory shall include a statement in such report to the effect that such transfer is being made as a gift), (ii) the sale of the shares of common stock to be sold pursuant to this prospectus and (iii) beginning on the date which is 30 days after the date of this prospectus, sales of common stock pursuant to any written requirements of Rule 10b5-1 under the Exchange Act currently in effect on the date of this prospectus (provided, that any filing made under the Exchange Act in connection with such a sale shall disclose that such sale was made pursuant to a Rule 10b5-1 trading plan entered into on a date before the date of this prospectus). As of the date of this prospectus, Darren Lampert and Michael Salaman have trading plans in effect intended to comply with Rule 10b5-1 under the Securities Exchange Act of 1934, as amended, covering up to approximately 800,000 shares of our common stock in the aggregate (400,000 shares each) at varying prices.
53
Rules of the SEC may limit the ability of the underwriters to bid for or purchase shares of common stock before the distribution of the shares is completed. However, the underwriters may engage in the following activities in accordance with the rules:
| ● | Stabilizing transactions - the representative may make bids or purchases for the purpose of pegging, fixing or maintaining the price of the common stock, so long as stabilizing bids do not exceed a specified maximum. | |
| ● | Over-allotments and syndicate covering transactions - the underwriters may sell more shares of common stock in connection with this offering than the number of shares of common stock that they have committed to purchase. This over-allotment creates a short position for the underwriters. This short sales position may involve either “covered” short sales or “naked” short sales. Covered short sales are short sales made in an amount not greater than the underwriters’ over-allotment option to purchase additional shares of common stock in this offering described above. The underwriters may close out any covered short position either by exercising its over-allotment option or by purchasing shares of common stock in the open market. To determine how they will close the covered short position, the underwriters will consider, among other things, the price per share of common stock available for purchase in the open market, as compared to the price at which they may purchase shares of common stock through the over-allotment option. Naked short sales are short sales in excess of the over-allotment option. The underwriters must close out any naked short position by purchasing shares of common stock in the open market. A naked short position is more likely to be created if the underwriters are concerned that, in the open market after pricing, there may be downward pressure on the price per share of common stock that could adversely affect investors who purchase shares of common stock in this offering. | |
| ● | Penalty bids - if the representative purchases shares of common stock in the open market in a stabilizing transaction or syndicate covering transaction, it may reclaim a selling concession from the underwriters and selling group members who sold those shares of common stock as part of this offering. | |
| ● | Passive market making - market makers in the common stock who are underwriters or prospective underwriters may make bids for or purchases of shares of common stock, subject to limitations, until the time, if ever, at which a stabilizing bid is made. |
Similar to other purchase transactions, the underwriters’ purchases to cover the syndicate short sales or to stabilize the market price of our common stock may have the effect of raising or maintaining the market price of our common stock or preventing or mitigating a decline in the market price of our common stock. As a result, the price of our common stock may be higher than the price that might otherwise exist in the open market. The imposition of a penalty bid might also have an effect on the price of the common stock if it discourages resales of our shares of common stock.
Neither we nor the underwriters make any representation or prediction as to the effect that the transactions described above may have on the price of our common stock. These transactions may occur on the Nasdaq Capital Market or otherwise. If such transactions are commenced, they may be discontinued without notice at any time.
Electronic Delivery of Prospectus: A prospectus in electronic format may be delivered to potential investors by one or more of the underwriters participating in this offering. The prospectus in electronic format will be identical to the paper version of such prospectus. Other than the prospectus in electronic format, the information on any underwriter’s website and any information contained in any other website maintained by an underwriter is not part of this prospectus or the registration statement of which this prospectus forms a part.
54
Notice to Non-U.S. Investors
European Economic Area and the United Kingdom
In relation to each Member State of the European Economic Area and the United Kingdom (each, a “Relevant State”), no shares have been offered or will be offered pursuant to the offering to the public in that Relevant State prior to the publication of a prospectus in relation to the shares which has been approved by the competent authority in that Relevant State or, where appropriate, approved in another Relevant State and notified to the competent authority in that Relevant State, all in accordance with the Prospectus Regulation), except that offers of the shares may be made to the public in that Relevant State at any time under the following exemptions under the Prospectus Regulation:
| A. | to any legal entity which is a qualified investor as defined under the Prospectus Regulation; |
| B. | to fewer than 150 natural or legal persons (other than qualified investors as defined under the Prospectus Regulation), subject to obtaining the prior consent of the representative for any such offer; or |
| C. | in any circumstances falling within Article 1(4) of the Prospectus Regulation, |
provided that no such offer of shares shall require the issuer or any of the representatives to publish a prospectus pursuant to Article 3 of the Prospectus Regulation or supplement a prospectus pursuant to Article 23 of the Prospectus Regulation.
In the case of any shares being offered to a financial intermediary as that term is used in Article 5(1) of the Prospectus Regulation, each such financial intermediary will be deemed to have represented, acknowledged and agreed that the shares acquired by it in the offer have not been acquired on a non-discretionary basis on behalf of, nor have they been acquired with a view to their offer or resale to, persons in circumstances which may give rise to an offer to the public other than their offer or resale in a Relevant State to qualified investors, in circumstances in which the prior consent of the representatives has been obtained to each such proposed offer or resale.
We, the representative and each of our and the representative’s respective affiliates will rely upon the truth and accuracy of the foregoing representations, acknowledgements and agreements.
For the purposes of this provision, the expression an “offer to the public” in relation to any shares in any Relevant State means the communication in any form and by any means of sufficient information on the terms of the offer and any shares to be offered so as to enable an investor to decide to purchase or subscribe for any shares, and the expression “Prospectus Regulation” means Regulation (EU) 2017/1129.
References to the Prospectus Regulation include, in relation to the United Kingdom, the Prospectus Regulation as it forms part of United Kingdom domestic law by virtue of the European Union (Withdrawal) Act 2018.
The above selling restriction is in addition to any other selling restrictions set out below.
In connection with the offering, the representative is not acting for anyone other than the issuer and will not be responsible to anyone other than the issuer for providing the protections afforded to their clients nor for providing advice in relation to the offering.
United Kingdom
This document is for distribution only to persons who (i) have professional experience in matters relating to investments and who qualify as investment professionals within the meaning of Article 19(5) of the Financial Services and Markets Act 2000 (Financial Promotion) Order 2005 (as amended, the “Financial Promotion Order”), (ii) are persons falling within Article 49(2)(a) to (d) (“high net worth companies, unincorporated associations etc.”) of the Financial Promotion Order, (iii) are outside the United Kingdom, or (iv) are persons to whom an invitation or inducement to engage in investment activity (within the meaning of Section 21 of the Financial Services and Markets Act 2000, as amended (“FSMA”)) in connection with the issue or sale of any securities may otherwise lawfully be communicated or caused to be communicated (all such persons together being referred to as “relevant persons”). This document is directed only at relevant persons and must not be acted on or relied on by persons who are not relevant persons. Any investment or investment activity to which this document relates is available only to relevant persons and will be engaged in only with relevant persons.
Canada
The shares may be sold only to purchasers purchasing, or deemed to be purchasing, as principal that are accredited investors, as defined in National Instrument 45-106 Prospectus Exemptions or subsection 73.3(1) of the Securities Act (Ontario), and are permitted clients, as defined in National Instrument 31-103 Registration Requirements, Exemptions and Ongoing Registrant Obligations. Any resale of the shares must be made in accordance with an exemption from, or in a transaction not subject to, the prospectus requirements of applicable securities laws.
Securities legislation in certain provinces or territories of Canada may provide a purchaser with remedies for rescission or damages if this prospectus supplement (including any amendment thereto) contains a misrepresentation, provided that the remedies for rescission or damages are exercised by the purchaser within the time limit prescribed by the securities legislation of the purchaser’s province or territory. The purchaser should refer to any applicable provisions of the securities legislation of the purchaser’s province or territory for particulars of these rights or consult with a legal advisor.
Pursuant to section 3A.3 of National Instrument 33-105 Underwriting Conflicts (NI 33-105), the underwriters are not required to comply with the disclosure requirements of NI 33-105 regarding underwriter conflicts of interest in connection with this offering.
55
Israel
In the State of Israel, this prospectus supplement shall not be regarded as an offer to the public to purchase shares of common stock under the Israeli Securities Law, 5728 – 1968, which requires a prospectus to be published and authorized by the Israel Securities Authority, if it complies with certain provisions of Section 15 of the Israeli Securities Law, 5728 – 1968, including, inter alia, if: (i) the offer is made, distributed or directed to not more than 35 investors, subject to certain conditions (the “Addressed Investors”); or (ii) the offer is made, distributed or directed to certain qualified investors defined in the First Addendum of the Israeli Securities Law, 5728 –1968, subject to certain conditions (the “Qualified Investors”). The Qualified Investors shall not be taken into account in the count of the Addressed Investors and may be offered to purchase securities in addition to the 35 Addressed Investors. The company has not and will not take any action that would require it to publish a prospectus in accordance with and subject to the Israeli Securities Law, 5728 – 1968. We have not and will not distribute this prospectus supplement or make, distribute or direct an offer to subscribe for our common stock to any person within the State of Israel, other than to Qualified Investors and up to 35 Addressed Investors.
Qualified Investors may have to submit written evidence that they meet the definitions set out in of the First Addendum to the Israeli Securities Law, 5728 – 1968. In particular, we may request, as a condition to be offered common stock, that Qualified Investors will each represent, warrant and certify to us and/or to anyone acting on our behalf: (i) that it is an investor falling within one of the categories listed in the First Addendum to the Israeli Securities Law, 5728 – 1968; (ii) which of the categories listed in the First Addendum to the Israeli Securities Law, 5728 – 1968 regarding Qualified Investors is applicable to it; (iii) that it will abide by all provisions set forth in the Israeli Securities Law, 5728 – 1968 and the regulations promulgated thereunder in connection with the offer to be issued common stock; (iv) that the shares of common stock that it will be issued are, subject to exemptions available under the Israeli Securities Law, 5728 – 1968: (a) for its own account; (b) for investment purposes only; and (c) not issued with a view to resale within the State of Israel, other than in accordance with the provisions of the Israeli Securities Law, 5728 – 1968; and (v) that it is willing to provide further evidence of its Qualified Investor status. Addressed Investors may have to submit written evidence in respect of their identity and may have to sign and submit a declaration containing, inter alia, the Addressed Investor’s name, address and passport number or Israeli identification number.
We have not authorized and do not authorize the making of any offer of securities through any financial intermediary on our behalf, other than offers made by the underwriters and their respective affiliates, with a view to the final placement of the securities as contemplated in this document. Accordingly, no purchaser of the shares, other than the underwriters, is authorized to make any further offer of shares on our behalf or on behalf of the underwriters.
Switzerland
The shares may not be publicly offered in Switzerland and will not be listed on the SIX Swiss Exchange (“SIX”) or on any other stock exchange or regulated trading facility in Switzerland. This document does not constitute a prospectus within the meaning of, and has been prepared without regard to the disclosure standards for issuance prospectuses under art. 652a or art. 1156 of the Swiss Code of Obligations or the disclosure standards for listing prospectuses under art. 27 ff. of the SIX Listing Rules or the listing rules of any other stock exchange or regulated trading facility in Switzerland. Neither this document nor any other offering or marketing material relating to the shares or the offering may be publicly distributed or otherwise made publicly available in Switzerland.
Neither this document nor any other offering or marketing material relating to the offering, the Company or the shares have been or will be filed with or approved by any Swiss regulatory authority. In particular, this document will not be filed with, and the offer of shares will not be supervised by, the Swiss Financial Market Supervisory Authority (“FINMA”), and the offer of shares has not been and will not be authorized under the Swiss Federal Act on Collective Investment Schemes (“CISA”). The investor protection afforded to acquirers of interests in collective investment schemes under the CISA does not extend to acquirers of shares.
56
Robinson & Cole, LLP, 1055 Washington Boulevard, Stamford, CT 06901 has acted as our counsel in connection with the preparation of this prospectus. The law firm of Andrew I. Telsey, P.C., 12835 E. Arapahoe Road, Suite I-803, Centennial, CO 80112 has acted as our special Colorado local counsel in connection with the issuance of an opinion relating to the validity of the securities offered in this prospectus. White & Case LLP, 1221 Avenue of the Americas, New York, NY 10020, has acted as counsel for the underwriters.
The consolidated financial statements of GrowGeneration Corp. appearing in this prospectus and related registration statement have been audited by Connolly Grady & Cha, LLP (“Connolly”), an independent registered public accounting firm, as set forth in their report thereon and are included in reliance upon such report given on the authority of such firm as experts in accounting and auditing.
On March 27, 2019, the Audit Committee of the Company approved the dismissal of Connolly as the Company’s independent registered public accounting firm. The reports of Connolly on the Company’s consolidated financial statements for the fiscal years ended December 31, 2019 and 2018 did not contain an adverse opinion or a disclaimer of opinion, and were not qualified or modified as to uncertainty, audit scope or accounting principles. During the fiscal years ended December 31, 2019 and 2018, and through March 27, 2020, there have been no “disagreements” (as defined in Item 304(a)(1)(iv) of Regulation S-K and related instructions) with Connolly on any matter of accounting principles or practices, financial statement disclosure or auditing scope or procedure, which disagreements if not resolved to the satisfaction of Connolly would have caused Connolly to make reference thereto in its reports on the consolidated financial statements for such years. During the fiscal years ended December 31, 2019 and 2018 and through March 27, 2020, there have been no “reportable events” (as defined in Item 304(a)(1)(v) of Regulation S-K).
Effective as of March 27, 2020, the Company engaged Plante & Moran, PLLC (“Plante Moran”) as its new registered independent public accountant. During the fiscal years ended December 31, 2019 and 2018, and through March 27, 2020, neither the Company, nor anyone on its behalf, consulted Plante Moran regarding either (i) the application of accounting principles to a specified transaction, either completed or proposed, or the type of audit opinion that might be rendered with respect to the consolidated financial statements of the Company, and no written report or oral advice was provided to the Company by Plante Moran that was an important factor considered by the Company in reaching a decision as to any accounting, auditing or financial reporting issue; or (ii) any matter that was the subject of a “disagreement” (as defined in Item 304(a)(1)(iv) of Regulation S-K and the related instructions) or a “reportable event” (as that term is defined in Item 304(a)(1)(v) of Regulation S-K).
WHERE YOU CAN FIND ADDITIONAL INFORMATION
We have filed with the SEC a registration statement on Form S-1 under the Securities Act, with respect to the common stock offered by this prospectus. This prospectus, which is part of the registration statement, does not contain all of the information set forth in the registration statement and omits certain information, exhibits, schedules and undertakings set forth in the registration statement. For further information pertaining to us and our common stock, reference is made to the registration statement and the exhibits and schedules to the registration statement. Statements contained in this prospectus as to the contents or provisions of any documents referred to in this prospectus are not necessarily complete, and in each instance where a copy of the document has been filed as an exhibit to the registration statement, reference is made to the exhibit for a more complete description of the matters involved.
You may read and copy all or any portion of the registration statement at the SEC’s website at http://www.sec.gov. We also maintain a website at www.GrowGeneration.com. The information contained on, or that can be accessed through, our website is not part of, and is not incorporated into, this prospectus. We have included our website in this prospectus solely as an inactive textual reference, and you should not consider the contents of our website in making an investment decision with respect to our common stock. The registration statement, including all exhibits and amendments to the registration statement, has been filed electronically with the SEC.
You may access our annual reports on Form 10-K, quarterly reports on Form 10-Q, current reports on Form 8-K, and amendments to those reports filed or furnished pursuant to Section 13(a) or 15(d) of the Exchange Act with the SEC free of charge at our website as soon as reasonably practicable after such material is electronically filed with, or furnished to, the SEC.
57
December 31, 2020 and 2019
F-1
GROWGENERATION CORPORATION AND SUBSIDIARIES
CONSOLIDATED BALANCE SHEETS
| March 31, 2020 | December 31, 2019 | |||||||
| (Unaudited) | ||||||||
| ASSETS | ||||||||
| Current assets: | ||||||||
| Cash | $ | 11,441,225 | $ | 12,979,444 | ||||
| Accounts receivable (net of allowance for credit losses of $291,372) | 4,575,300 | 4,455,209 | ||||||
| Inventory | 28,671,398 | 22,659,357 | ||||||
| Prepaid expenses and other current assets | 4,240,843 | 2,549,559 | ||||||
| Total current assets | 48,928,766 | 42,643,569 | ||||||
| Property and equipment, net | 3,711,479 | 3,340,616 | ||||||
| Operating leases right-of-use assets, net | 7,240,673 | 7,628,591 | ||||||
| Intangible assets, net | 564,671 | 233,280 | ||||||
| Goodwill | 19,650,370 | 17,798,932 | ||||||
| Other assets | 363,554 | 377,364 | ||||||
| TOTAL ASSETS | $ | 80,459,513 | $ | 72,022,352 | ||||
| LIABILITIES & STOCKHOLDERS’ EQUITY | ||||||||
| Current liabilities: | ||||||||
| Accounts payable | $ | 9,147,215 | $ | 6,024,750 | ||||
| Other accrued liabilities | 51,287 | - | ||||||
| Payroll and payroll tax liabilities | 1,779,035 | 1,072,142 | ||||||
| Customer deposits | 3,554,469 | 2,503,785 | ||||||
| Sales tax payable | 755,381 | 533,656 | ||||||
| Current maturities of operating leases liability | 1,893,594 | 1,836,700 | ||||||
| Current maturities of long-term debt | 82,876 | 110,231 | ||||||
| Total current liabilities | 17,263,857 | 12,081,264 | ||||||
| Operating leases liability, net of current maturities | 5,484,090 | 5,807,266 | ||||||
| Long-term debt, net of current maturities | 230,820 | 242,079 | ||||||
| Total liabilities | 22,978,767 | 18,130,609 | ||||||
| Commitments and contingencies | ||||||||
| Stockholders’ Equity: | ||||||||
| Common stock; $.001 par value; 100,000,000 shares authorized; 38,209,300 and 36,876,305 shares issued and outstanding, respectively | 38,209 | 36,876 | ||||||
| Additional paid-in capital | 66,423,243 | 60,742,055 | ||||||
| Accumulated deficit | (8,980,706 | ) | (6,887,188 | ) | ||||
| Total stockholders’ equity | 57,480,746 | 53,891,743 | ||||||
| TOTAL LIABILITIES AND STOCKHOLDERS’ EQUITY | $ | 80,459,513 | $ | 72,022,352 | ||||
See Notes to the Unaudited Consolidated Financial Statements.
F-2
GROWGENERATION CORPORATION AND SUBSIDIARIES
CONSOLIDATED STATEMENT OF OPERATIONS
(Unaudited)
| Three Months Ended March 31, | ||||||||
| 2020 | 2019 | |||||||
| Sales | $ | 32,981,506 | $ | 13,087,222 | ||||
| Cost of sales | 24,035,257 | 9,400,591 | ||||||
| Gross profit | 8,946,249 | 3,686,631 | ||||||
| Operating expenses: | ||||||||
| Store operations | 3,638,685 | 1,957,790 | ||||||
| General and administrative | 1,152,577 | 493,096 | ||||||
| Share based compensation | 4,115,068 | 80,278 | ||||||
| Depreciation and amortization | 359,142 | 146,624 | ||||||
| Salaries and related expenses | 1,797,760 | 659,332 | ||||||
| Total operating expenses | 11,063,232 | 3,337,120 | ||||||
| (Loss) income from operations | (2,116,983 | ) | 349,511 | |||||
| Other income (expense): | ||||||||
| Interest expense | (7,181 | ) | (131,637 | ) | ||||
| Interest income | 24,842 | 18,833 | ||||||
| Other income (loss) | 5,804 | (7,286 | ) | |||||
| Total non-operating income (expense), net | 23,465 | (120,090 | ) | |||||
| Net (loss) income | $ | (2,093,518 | ) | $ | 229,421 | |||
| Net (loss) income per shares, basic | $ | (.055 | ) | $ | .01 | |||
| Net (loss) income per shares, diluted | $ | (.055 | ) | $ | .01 | |||
| Weighted average shares outstanding, basic | 37,823,304 | 28,437,132 | ||||||
| Weighted average shares outstanding, diluted | 37,823,304 | 34,263,302 | ||||||
See Notes to the Unaudited Consolidated Financial Statements.
F-3
GROWGENERATION CORPORATION AND SUBSIDIARIES
CONSOLIDATED STATEMENTS OF STOCKHOLDERS’ EQUITY
THREE MONTHS ENDED MARCH 31, 2020 and 2019
(Unaudited)
| Additional | Total | |||||||||||||||||||
| Common Stock | Paid-In | Accumulated | Stockholders’ | |||||||||||||||||
| Shares | Amount | Capital | (Deficit) | Equity | ||||||||||||||||
| Balances, December 31, 2018 | 27,948,609 | $ | 27,949 | $ | 38,796,562 | $ | (8,765,992 | ) | $ | 30,058,519 | ||||||||||
| Common stock issued upon warrant exercise | 172,500 | 172 | 1,552 | 1,724 | ||||||||||||||||
| Common stock issued upon cashless exercise of options | 228,890 | 229 | (229 | ) | - | |||||||||||||||
| Common stock issued in connection with business combinations | 344,553 | 345 | 998,406 | 998,751 | ||||||||||||||||
| Common stock issued for prepaid services | 50,000 | 50 | 95,950 | 96,000 | ||||||||||||||||
| Common stock issued for accrued share-based compensation | 100,000 | 100 | 210,100 | 210,200 | ||||||||||||||||
| Share based compensation | (8,951 | ) | (8,951 | ) | ||||||||||||||||
| Net income | 229,421 | 229,421 | ||||||||||||||||||
| Balances, March 31, 2019 | 28,844,552 | $ | 28,845 | $ | 40,093,390 | $ | (8,536,571 | ) | $ | 31,585,664 | ||||||||||
| Balances, December 31, 2019 | 36,876,305 | $ | 36,876 | $ | 60,742,055 | $ | (6,887,188 | ) | $ | 53,891,743 | ||||||||||
| Common stock issued upon warrant exercise | 191,235 | 191 | 509,928 | 510,119 | ||||||||||||||||
| Common stock issued upon cashless warrant exercise | 18,712 | 19 | (19 | ) | - | |||||||||||||||
| Common stock issued upon cashless exercise of options | 279,823 | 280 | (280 | ) | - | |||||||||||||||
| Common stock issued in connection with business combinations | 273,892 | 274 | 1,203,050 | 1,203,324 | ||||||||||||||||
| Common stock issued for services | 50,000 | 50 | (50 | ) | - | |||||||||||||||
| Common stock issued for share based compensation | 519,333 | 519 | 1,759,913 | 1,760,432 | ||||||||||||||||
| Share based compensation | - | 2,208,646 | 2,208,646 | |||||||||||||||||
| Net loss | (2,093,518 | ) | (2,093,518 | ) | ||||||||||||||||
| Balances, March 31, 2020 | 38,209,300 | $ | 38,209 | $ | 66,423,243 | $ | (8,980,706 | ) | $ | 57,480,746 | ||||||||||
See Notes to the Unaudited Consolidated Financial Statements.
F-4
GROWGENERATION CORPORATION AND SUBSIDIARIES
CONSOLIDATED STATEMENT OF CASH FLOWS
(Unaudited)
| For the three months ended March 31, | ||||||||
| 2020 | 2019 | |||||||
| Cash flows from operating activities: | ||||||||
| Net income (loss) | $ | (2,093,518 | ) | $ | 229,421 | |||
| Adjustments to reconcile net loss to net cash used in operating activities: | ||||||||
| Depreciation and amortization | 359,142 | 146,624 | ||||||
| Amortization of debt discount | - | 124,946 | ||||||
| Stock-based compensation expense | 4,115,068 | 80,278 | ||||||
| Bad debt | 20,632 | - | ||||||
| Changes in operating assets and liabilities: | ||||||||
| (Increase) decrease in: | ||||||||
| Accounts receivable | (140,723 | ) | (215,309 | ) | ||||
| Inventory | (4,960,155 | ) | (4,050,616 | ) | ||||
| Prepaid expenses and other assets | (1,823,464 | ) | (619,382 | ) | ||||
| Increase (decrease) in: | ||||||||
| Accounts payable and accrued liabilities | 3,173,752 | 1,205,744 | ||||||
| Operating leases | 121,636 | 27,297 | ||||||
| Payroll and payroll tax liabilities | 706,893 | 315,133 | ||||||
| Customer deposits | 1,050,684 | 181,544 | ||||||
| Sales tax payable | 221,725 | 112,751 | ||||||
| Net cash provided by (used in) operating activities | 751,672 | (2,461,569 | ) | |||||
| Cash flows from investing activities: | ||||||||
| Assets acquired in business combinations | (1,750,000 | ) | (4,984,075 | ) | ||||
| Purchase of furniture and equipment | (652,187 | ) | (430,148 | ) | ||||
| Purchase of intangibles | (359,209 | ) | (105,500 | ) | ||||
| Net cash used in investing activities | (2,761,396 | ) | (5,519,723 | ) | ||||
| Cash flows from financing activities: | ||||||||
| Principal payments on long term debt | (38,614 | ) | (99,560 | ) | ||||
| Proceeds from the sale of common stock and exercise of warrants, net of expenses | 510,119 | 1,725 | ||||||
| Net cash provided by (used in) financing activities | 471,505 | (97,835 | ) | |||||
| Net decrease in cash | (1,538,219 | ) | (8,079,128 | ) | ||||
| Cash at the beginning of period | 12,979,444 | 14,639,981 | ||||||
| Cash at the end of period | $ | 11,441,225 | $ | 6,560,853 | ||||
| Supplemental disclosures of non-cash financing activities: | ||||||||
| Cash paid for interest | $ | 7,181 | 18,833 | |||||
| Common stock issued for accrued payroll | $ | - | 210,200 | |||||
| Common stock issued for prepaid services | $ | - | 96,000 | |||||
| Assets acquired by issuance of common stock | $ | 1,203,324 | 998,751 | |||||
| Right to use assets acquired under operating leases | $ | 192,614 | 1,791,307 | |||||
See Notes to the Unaudited Consolidated Financial Statements.
F-5
GrowGeneration Corporation and Subsidiaries
Notes to the Unaudited Consolidated Financial Statements
March 31, 2020
| 1. | NATURE OF OPERATIONS |
GrowGeneration is the largest chain of hydroponic garden centers in North America and is a leading marketer and distributor of nutrients, growing media, advanced indoor and greenhouse lighting, ventilation systems and accessories for hydroponic gardening. As of March 31, 2020, the Company owns and operates a chain of twenty seven (27) retail hydroponic/gardening stores, with five (5) located in the state of Colorado, four (4) in the state of California, four (4) in the state of Michigan, two (2) in the state of Nevada, one (1) in the state of Washington, one (1) in the state of Oregon, four (4) in the State of Oklahoma, one (1) in the state of Rhode Island, three (3) in Maine, (1) in Florida, one (1) distribution center in California and an online e-commerce store, GrowGen.Pro. In addition, we operate a warehouse out of Sacramento, CA. Our plan is to acquire, open and operate hydroponic/gardening stores and related businesses throughout the United States and Canada.
The Company engages in its business through its wholly-owned subsidiaries, GrowGeneration Pueblo Corp, GrowGeneration California Corp, GrowGeneration Nevada Corp, GrowGeneration Washington Corp, GrowGeneration Rhode Island Corp, GrowGeneration Oklahoma Corp, GrowGeneration Canada, GrowGeneration HG Corp, GrowGeneration Hemp Corp, GGen Distribution Corp, GrowGeneration Michigan Corp, GrowGeneration New England Corp, GrowGeneration Florida Corp and GrowGeneration Management Corp.
| 2. | BASIS OF PRESENTATION AND SUMMARY OF SIGNIFICANT ACCOUNTING POLICIES |
Principles of Consolidation
The accompanying unaudited condensed consolidated interim financial statements include our accounts and those of our wholly-owned subsidiaries, and reflect all adjustments which are necessary for a fair statement of the financial position, results of operations, and cash flows for the periods presented in accordance with accounting principles generally accepted in the United States of America (“U.S. GAAP”). Such unaudited condensed consolidated interim financial statements have been prepared in accordance with the instructions to Form 10-Q pursuant to the rules and regulations of the U.S. Securities and Exchange Commission. All significant intercompany balances and transactions are eliminated in consolidation. Certain information and footnote disclosures normally included in financial statements prepared in accordance with U.S. GAAP have been condensed or omitted pursuant to such rules and regulations. The year-end condensed balance sheet data was derived from audited financial statements but does not include all disclosures required by U.S. GAAP.
These unaudited condensed consolidated interim financial statements should be read in conjunction with our Annual Report on Form
10-K for the year ended December 31, 2019 (“Annual Report”) filed on March 27, 2020, and have been prepared on
a consistent basis with the accounting policies described in Note 1 of the Notes to the Audited Consolidated Financial Statements
included in our Annual Report. Our accounting policies did not change during the three months ended March 31, 2020.
F-6
GrowGeneration Corporation and Subsidiaries
Notes to the Unaudited Consolidated Financial Statements
March 31, 2020
| 2. | BASIS OF PRESENTATION AND SUMMARY OF SIGNIFICANT ACCOUNTING POLICIES, continued |
Use of Estimates
Management uses estimates and assumptions in preparing these financial statements in accordance with GAAP. These estimates and assumptions affect the reported amounts of assets and liabilities, the disclosure of contingent assets and liabilities at the date of the financial statements, and the reported revenues and expenses during the reporting period. Actual results could vary from the estimates that were used.
Additionally, the full impact of COVID-19 is unknown and cannot be reasonably estimated. However, we have made appropriate accounting estimates based on the facts and circumstances available as of the reporting date. To the extent there are differences between these estimates and actual results, our consolidated financial statements may be materially affected.
As we continue to monitor the COVID-19 situation, the Company is considered an “essential” supplier to the agricultural industry, suppling the nutrients and nourishment required to feed their plants. The Company has been opened during this difficult time. We have plans and procedures in place to ensure our customers and employees stay safe during this time of uncertainty. As a result of COVID-19 we reduced some hours of operations at the store level and some stores were closed on the weekends, primarily in the later part of the first quarter of 2020. There have been some minor delays in vendor shipments as their warehouses and supply chain were affected by staffing shortages. The Company successfully implemented a will call and curb side pick-up process that is working well. Other than what has been disclosed above, we have not experienced adverse effects from COVID-19.
Leases
We assess whether an arrangement is a lease at inception. Leases with an initial term of 12 months or less are not recorded on the balance sheet. We have elected the practical expedient to not separate lease and non-lease components for all assets. Operating lease assets and operating lease liabilities are calculated based on the present value of the future minimum lease payments over the lease term at the lease start date. As most of our leases do not provide an implicit rate, we use our incremental borrowing rate based on the information available at the lease start date in determining the present value of future payments. The operating lease asset is increased by any lease payments made at or before the lease start date and reduced by lease incentives and initial direct costs incurred. The lease term includes options to renew or terminate the lease when it is reasonably certain that we will exercise that option. The exercise of lease renewal options is at our sole discretion. The depreciable life of lease assets and leasehold improvements are limited by the lease term. Lease expense for operating leases is recognized on a straight-line basis over the lease term.
Income Taxes
The Company accounts for income taxes in accordance with the Financial Accounting Standards Board (“FASB”) Accounting Standards Codification (“ASC”) 740, Income Taxes, which requires the recognition of deferred tax assets and liabilities for future tax consequences attributable to differences between the financial statement carrying amounts of existing assets and liabilities and their respective tax bases and tax credit carry forwards. Deferred tax assets and liabilities are measured using enacted tax rates expected to apply to taxable income in the years in which those temporary differences are expected to be recovered or settled. The effect on deferred tax assets and liabilities of a change in tax rates is recognized in operations in the period that includes the enactment date. A valuation allowance is provided for the amount of deferred tax assets that would otherwise be recorded for income tax benefits primarily relating to operating loss carryforwards as realization cannot be determined to be more likely than not.
F-7
GrowGeneration Corporation and Subsidiaries
Notes to the Unaudited Consolidated Financial Statements
March 31, 2020
| 2. | BASIS OF PRESENTATION AND SUMMARY OF SIGNIFICANT ACCOUNTING POLICIES, continued |
The Company adopted the provisions of FASB ASC 740-10-25, which prescribes a recognition threshold and measurement attribute for the recognition and measurement of tax positions taken or expected to be taken in income tax returns. FASB ASC 740-10-25 also provides guidance on recognition of income tax assets and liabilities, classification of current and deferred income tax assets and liabilities, and accounting for interest and penalties associated with tax positions. The Company’s tax returns are subject to tax examinations by U.S. federal and state authorities until their respective statute of limitation. Currently, the 2019, 2018 and 2017 tax years are open and subject to examination by taxing authorities. However, the Company is not currently under audit nor has the Company been contacted by any of the taxing authorities. The Company does not have any accrual for uncertain tax positions as of March 31, 2020.
There is no income tax provision, and as such no effective tax rate (“ETR”), in the accompanying condensed consolidated statement of operations due to the cumulative operating losses that indicate a 100% valuation allowance for the deferred tax assets and state income taxes is appropriate.
Revenue Recognition
The Company recognizes revenue, net of estimated returns and sales tax, at the time the customer takes possession of merchandise or receives services at which point, the performance obligation is satisfied. Sales and other taxes collected concurrent with revenue producing activities are excluded from revenue. In the normal course of business, the Company does not accept product returns unless the item is defective as manufactured. The Company monitors provisions for estimated returns. Payment for goods and services sold by the Company is typically due upon satisfaction of the performance obligations. Under certain circumstances, the Company does provide goods and services to customers on a credit basis (see Accounts Receivable below). The Company accounts for shipping and handling activities as a fulfillment costs rather than as a separate performance obligation. When the Company receives payment from customers before the customer has taken possession of the merchandise or the service has been performed, the amount received is recorded as Deferred Revenue in the accompanying Consolidated Balance Sheets until the sale or service is complete.
Accounts Receivable
Accounts receivable are stated at the amount the Company expects to collect from balances outstanding at year-end, based on the Company’s assessment of the credit history with customers having outstanding balances and current relationships with them. A reserve for uncollectable receivables is established when collection of amounts due is deemed improbable. Indicators of improbable collection include client bankruptcy, client litigation, client cash flow difficulties or ongoing service or billing disputes. Credit is generally extended on a short-term basis thus receivables do not bear interest. At March 31, 2020 and December 31, 2019, the Company established an allowance for doubtful accounts of $291,372, respectively.
Inventory
Inventory consists primarily of gardening supplies and materials and is recorded at the lower of cost (first-in, first-out method) or market. The Company periodically reviews the value of items in inventory and provides write-downs or write-offs of inventory based on its assessment of market conditions. Write-downs and write-offs are charged to cost of goods sold.
F-8
GrowGeneration Corporation and Subsidiaries
Notes to the Unaudited Consolidated Financial Statements
March 31, 2020
| 2. | BASIS OF PRESENTATION AND SUMMARY OF SIGNIFICANT ACCOUNTING POLICIES, continued |
Property and Equipment
Property and equipment are carried at cost. Leasehold Improvements are amortized using the straight-line method over the original term of the lease or the useful life of the improvement, whichever is shorter. Renewals and betterment that materially extend the life of the asset are capitalized. Expenditures for maintenance and repairs are charged against operations. Depreciation of property and equipment is provided on the straight-line method for financial reporting purposes at rates based on the following estimated useful lives:
| Estimated Lives | ||
| Vehicle | 5 years | |
| Furniture and fixtures | 5-7 years | |
| Computers and equipment | 3-5 years | |
| Leasehold improvements | 10 years not to exceed lease term |
Goodwill
Goodwill represents the excess of purchase price over the fair value of net assets. The Company accounts for goodwill in accordance with the provisions of FASB Accounting Standards Update (ASU) 2014-02, Intangibles – Goodwill and Other (Topic 350) Accounting for Goodwill. In accordance with FASB ASC Topic 350 for Intangibles – Goodwill and Other, goodwill is not amortized but is reviewed for potential impairment on an annual basis, or if events or circumstances indicate a potential impairment, at the reporting unit level. The Company’s review for impairment includes an assessment of qualitative factors to determine whether it is more likely than not that the fair value of a reporting unit is less than its carrying value, including goodwill. If it is determined that it is more likely than not that the fair value of a reporting unit is less than its carrying value, including goodwill, the first step of the two-step quantitative goodwill impairment test is performed, which compares the fair value of the reporting unit with its´ carrying amounts, including goodwill. If the fair value of the reporting unit exceeds its carrying amount, goodwill of the reporting unit is considered not impaired. However, if the carrying amount of the reporting unit exceeds its fair value, additional procedures must be performed. That additional procedure compares the implied fair value of the reporting unit’s goodwill with the carrying amount of that goodwill. An impairment loss is recorded to the extent that the carrying amount of goodwill exceeds its implied fair value.
Stock Based Compensation
The Company records stock-based compensation in accordance with FASB ASC Topic 718, Compensation-Stock Compensation (“ASC 718”). The Company estimates the fair value of stock options using the Black-Scholes option pricing model. The fair value of stock options granted is recognized as an expense over the requisite service period. Stock-based compensation expense for all share-based payment awards are recognized using the straight-line single-option method.
The Black-Scholes option pricing model requires subjective assumptions, including future stock price volatility and expected time to exercise, which greatly affect the calculated values. The expected term of options granted is derived from historical data on employee exercises and post-vesting employment termination behavior. The risk-free rate selected to value any particular grant is based on the U.S. Treasury rate that corresponds to the expected life of the grant effective as of the date of the grant. The expected volatility is based on the historical volatility of the Company’s stock price. These factors could change in the future, affecting the determination of stock-based compensation expense in future periods.
F-9
GrowGeneration Corporation and Subsidiaries
Notes to the Unaudited Consolidated Financial Statements
March 31, 2020
| 2. | BASIS OF PRESENTATION AND SUMMARY OF SIGNIFICANT ACCOUNTING POLICIES, continued |
New Accounting Pronouncements
As an emerging growth company, the Company is permitted to delay the adoption of new or revised accounting standards until such time as those standards apply to private companies. The Company has chosen to take advantage of the extended transition period for complying with new or revised accounting standards.
| 3. | RECENT ACCOUNTING PRONOUNCEMENTS |
Recently Adopted Accounting Pronouncements
During the first quarter of 2019, the Company adopted the FASB ASU 2016-02, Leases (ASC 842), which introduces the balance sheet recognition of lease assets and lease liabilities by lessees for those leases classified as operating leases under previous guidance. The Company has adopted the new lease standard using the new transition option issued under the amendments in ASU 2018-11, Leases, which allowed the Company to continue to apply the legacy guidance in ASC 840, Leases, in the comparative periods presented in the year of adoption. The Company elected the package of practical expedients permitted under the transition guidance within the new standard, which among other things, allowed the Company to carry forward the historical lease classification. The Company made an accounting policy election to keep leases with an initial term of 12 months or less off the balance sheet. The Company will recognize those lease payments on a straight-line basis over the lease term. The impact of the adoption was an increase to the Company’s operating lease assets and liabilities on January 1, 2019 of $3.2 million.
On January 1, 2019, the Company also adopted ASU 2018-07, “Improvements to Nonemployee Share-Based Payment Accounting.” ASU 2018-07 more closely aligns the accounting for employee and nonemployee share-based payments. The amendment is effective commencing in 2019 with early adoption permitted. The adoption of this new guidance did not have a material impact on our Financial Statements.
In August 2018, the SEC adopted amendments to certain disclosure requirements in Securities Act Release No. 33-10532, Disclosure Update and Simplification. These amendments eliminate, modify, or integrate into other SEC requirements certain disclosure rules. Among the amendments is the requirement to present an analysis of changes in stockholders’ equity in the interim financial statements included in Quarterly Reports on Form 10-Q. The analysis, which can be presented as a footnote or separate statement, is required for the current and comparative quarter and year-to-date interim periods. The amendments are effective for all filings made on or after November 5, 2018. The Company adopted these amendments in its Quarterly Report on Form 10-Q for the quarter ended March 31, 2019.
In August 2018, the FASB issued ASU 2018-13, Fair Value Measurement (Topic 820): Disclosure Framework - Changes to the Disclosure Requirements for Fair Value Measurement. The new guidance modifies the disclosure requirements on fair value measurements in Topic 820. The amendments in ASU 2018-13 are effective for all entities for fiscal years, and interim periods within those fiscal years, beginning after December 15, 2019. The adoption of this new guidance, effective January 1, 2020 did not have a material impact on our Financial Statements.
F-10
GrowGeneration Corporation and Subsidiaries
Notes to the Unaudited Consolidated Financial Statements
March 31, 2020
| 3. | RECENT ACCOUNTING PRONOUNCEMENTS, continued |
Recently Issued Accounting Pronouncements – Pending Adoption
In June 2016, the FASB issued ASU No. 2016-13, “Financial Instruments — Credit Losses (Topic 326),” changing the impairment model for most financial instruments by requiring companies to recognize an allowance for expected losses, rather than incurred losses as required currently by the other-than-temporary impairment model. The ASU will apply to most financial assets measured at amortized cost and certain other instruments, including trade and other receivables, loans, available-for-sale and held-to-maturity debt securities, net investments in leases, and off-balance-sheet credit exposures. In November 2019, the FASB issued ASU No. 2019-10, changing effective dates for the new standards to give implementation relief to certain types of entities. The Company is required to adopt the new standards no later than January 1, 2023 according to ASU 2019-10, with early adoption allowed. We are currently evaluating the impact of adopting this new accounting guidance on our condensed consolidated financial statements.
In January 2017, the FASB issued ASU 2017-04, Intangibles - Goodwill and Other (Topic 350): Simplifying the Test for Goodwill Impairment. The guidance in ASU 2017-04 eliminates the requirement to determine the fair value of individual assets and liabilities of a reporting unit to measure goodwill impairment. Under the amendments in the new ASU, goodwill impairment testing will be performed by comparing the fair value of the reporting unit with its carrying amount and recognizing an impairment charge for the amount by which the carrying amount exceeds the reporting unit’s fair value. ASU 2017-04 is effective for annual and interim goodwill impairment tests in fiscal years beginning after December 15, 2022 and should be applied on a prospective basis. The Company is currently evaluating the impact of adopting this guidance on the Company’s consolidated financial statements.
In December 2019, the FASB issued new guidance to simplify the accounting for income taxes by removing certain exceptions to the general principles and also simplification of areas such as franchise taxes, step-up in tax basis goodwill, separate entity financial statements and interim recognition of enactment of tax laws or rate changes. The standard will be effective for annual reporting periods beginning after December 15, 2020, including interim reporting periods within those periods. We are currently evaluating the impact of adopting this new accounting guidance on our condensed consolidated financial statements.
| 4. | REVENUE RECOGNITION |
Disaggregation of Revenues
The following table disaggregates revenue by source:
| Three Months Ended March 31, 2020 | Three Months Ended March 31, 2019 | |||||||
| Sales at company owned stores | $ | 31,036,819 | $ | 12,405,923 | ||||
| E-commerce sales | 1,944,687 | 681,299 | ||||||
| Total Revenues | $ | 32,981,506 | $ | 13,087,222 | ||||
Contract Balances
Depending on when the timing of when a customer takes possession of product and when a customer make payments for such product, the Company recognizes a customer trade receivable (asset) or a customer deposit (liability). The difference between the opening and closing balances of the Company’s customer trade receivables and the customer deposit liability results from timing differences between the Company’s performance and the customer’s payment.
F-11
GrowGeneration Corporation and Subsidiaries
Notes to the Unaudited Consolidated Financial Statements
March 31, 2020
| 4. | REVENUE RECOGNITION, continued |
Contract Balances
Depending on the timing of when a customer takes possession of product and when a customer make payments for such product, the Company recognizes a customer trade receivable (asset) or a customer deposit (liability). The difference between the opening and closing balances of the Company’s customer trade receivables and the customer deposit liability results from timing differences between the Company’s performance and the customer’s payment.
The opening and closing balances of the Company’s customer trade receivables and customer deposit liability are as follows:
| Receivables | Customer Deposit Liability | |||||||
| Opening balance, 1/1/2020 | $ | 4,455,209 | $ | 2,503,785 | ||||
| Closing balance, 3/31/2020 | 4,575,300 | 3,554,469 | ||||||
| Increase (decrease) | $ | 120,091 | $ | 1,050,684 | ||||
| Opening balance, 1/1/2019 | $ | 862,397 | $ | 516,038 | ||||
| Closing balance, 3/31/2019 | 1,077,706 | 697,582 | ||||||
| Increase (decrease) | $ | 215,309 | $ | 181,544 | ||||
| 5. | PROPERTY AND EQUIPMENT |
| March 31, 2020 | December 31, 2019 | |||||||
| Vehicles | $ | 840,354 | $ | 702,447 | ||||
| Leasehold improvements | 1,205,530 | 884,685 | ||||||
| Furniture, fixtures and equipment | 3,532,019 | 3,305,323 | ||||||
| 5,577,903 | 4,892,455 | |||||||
| (Accumulated depreciation) | (1,866,424 | ) | (1,551,839 | ) | ||||
| Property and Equipment, net | $ | 3,711,479 | $ | 3,340,616 | ||||
Depreciation expense for the three months ended March 31, 2020 and 2019 was $331,324 and $146,624, respectively.
| 6. | GOODWILL AND INTANGIBLE ASSETS |
Goodwill: The changes in goodwill are as follows:
| March 31, 2020 | December 31, 2019 | |||||||
| Balance, beginning of year | $ | 17,798,932 | $ | 8,752,909 | ||||
| Goodwill additions | 1,851,438 | 9,046,023 | ||||||
| Impairments | - | - | ||||||
| Balance, end of year | $ | 19,650,370 | $ | 17,798,932 | ||||
F-12
GrowGeneration Corporation and Subsidiaries
Notes to the Unaudited Consolidated Financial Statements
March 31, 2020
| 6. | GOODWILL AND INTANGIBLE ASSETS, continued |
Intangible assets on the Company’s consolidated balance sheets consist of the following:
| March 31, 2020 | December 31, 2019 | |||||||||||||||
| Gross Carrying Amount | Accumulated Amortization | Gross Carrying Amount | Accumulated Amortization | |||||||||||||
| Patents and trademarks | $ | 100,000 | $ | - | $ | 100,000 | $ | - | ||||||||
| Capitalized software | 494,265 | 29,594 | 135,030 | 1,750 | ||||||||||||
| $ | 594,265 | $ | 29,594 | $ | 235,030 | $ | 1,750 | |||||||||
Amortization expense for the three months ended March 31, 2020 and 2019 was $27,818 and $0, respectively.
| 7. | LONG-TERM DEBT |
| March 31, | December 31, | |||||||
| 2020 | 2019 | |||||||
| Long term debt is as follows: | ||||||||
| Wells Fargo Equipment Finance, interest at 3.5% per annum, payable in monthly installments of $518.96 beginning April 2016 through March 2021, secured by warehouse equipment with a book value of $25,437 | $ | 4,752 | $ | 7,109 | ||||
| Notes payable issued in connection with seller financing of assets acquired, interest at 1%, payable in 24 installments of $24,996, due February 2020 | - | 24,997 | ||||||
| Notes payable issued in connection with seller financing of assets acquired, interest at 8.125%, payable in 60 installments of $8,440, due August 2023 | 308,944 | 320,204 | ||||||
| $ | 313,696 | $ | 352,310 | |||||
| Less Current Maturities | (82,876 | ) | (110,231 | ) | ||||
| Total Long-Term Debt | $ | 230,820 | $ | 242,079 | ||||
Interest expense for the three months ended March 31, 2020 and 2019 was $7,181 and $6,691, respectively.
| 8. | LEASES |
We determine if a contract contains a lease at inception. Our material operating leases consist of retail and warehouse locations as well as office space. Our leases generally have remaining terms of 1- 5 years, most of which include options to extend the leases for additional 3 to 5 year periods. Generally, the lease term is the minimum of the noncancelable period of the lease or the lease term inclusive of reasonably certain renewal periods.
Operating lease assets and liabilities are recognized at the lease commencement date. Operating lease liabilities represent the present value of lease payments not yet paid. Operating lease assets represent our right to use an underlying asset and are based upon the operating lease liabilities adjusted for prepayments or accrued lease payments, initial direct costs, lease incentives, and impairment of operating lease assets. To determine the present value of lease payments not yet paid, we estimate incremental secured borrowing rates corresponding to the maturities of the leases. Our leases typically contain rent escalations over the lease term. We recognize expense for these leases on a straight-line basis over the lease term.
F-13
GrowGeneration Corporation and Subsidiaries
Notes to the Unaudited Consolidated Financial Statements
March 31, 2020
| 8. | LEASES, continued |
We elected this expedient to account for lease and non-lease components as a single component for our entire population of operating lease assets.
We have elected the short-term lease recognition exemption for all applicable classes of underlying assets. Short-term disclosures include only those leases with a term greater than one month and 12 months or less, and expense is recognized on a straight-line basis over the lease term. Leases with an initial term of 12 months or less, that do not include an option to purchase the underlying asset that we are reasonably certain to exercise, are not recorded on the balance sheet.
Lease expense is recorded within our consolidated statements of operations based upon the nature of the assets. Where assets are used to directly serve our customers, such as facilities dedicated to customer contracts, lease costs are recorded in “cost of sales.” Facilities and assets which serve management and support functions are expensed through general and administrative expenses.
| March 31, 2020 | December 31, 2019 | |||||||
| Right to use assets, operating lease assets | $ | 7,240,673 | $ | 7,628,591 | ||||
| Current lease liability | $ | 1,893,594 | $ | 1,836,700 | ||||
| Non-current lease liability | 5,484,090 | 5,807,266 | ||||||
| $ | 7,377,684 | $ | 7,643,966 | |||||
| March 31, 2020 | March 31, 2019 | |||||||
| Weighted average remaining lease term | 3.24 years | 3.5 years | ||||||
| Weighted average discount rate | 7.6 | % | 7.6 | % | ||||
| March 31, 2020 | March 31, 2019 | |||||||
| Operating lease costs | $ | 924,583 | $ | 423,973 | ||||
| Short-term lease costs | 16,053 | 5,735 | ||||||
| Total operating lease costs | $ | 940,636 | $ | 429,708 | ||||
| The following table presents the maturity of the Company’s operating lease liabilities as of March 31, 2020: | ||||
| 2020 (remainder of the year) | $ | 1,930,342 | ||
| 2021 | 2,597,468 | |||
| 2022 | 2,150,123 | |||
| 2023 | 1,608,229 | |||
| 2024 | 813,984 | |||
| Thereafter | 1,433,499 | |||
| Total lease payments | 10,533,645 | |||
| Less: Imputed interest | (3,155,961 | ) | ||
| Lease Liability at March 31, 2020 | $ | 7,377,684 | ||
F-14
GrowGeneration Corporation and Subsidiaries
Notes to the Unaudited Consolidated Financial Statements
March 31, 2020
| 9. | CONVERTIBLE DEBT |
On January 12, 2018, the Company completed a private placement of a total of 36 units of the Company’s securities at the price of $250,000 per unit pursuant to Section 4(a)(2) of the Securities Act of 1933, as amended (the “Securities Act”) and Rule 506 of Regulation D promulgated under the Securities Act. Each Unit consisted of (i) a .1% unsecured convertible promissory note of the principal amount of $250,000, and (ii) a 3-year warrant entitling the holder to purchase 37,500 shares of the Company’s common stock, par value $.001 per share, at a price of $.01 per share or through cashless exercise.
The convertible debt has a maturity date of January 12, 2021 and the principal balance and any accrued interest is convertible by the holder at any time into common stock of the Company at conversion price of $3.00 a share. Principal due and interest accrued on the notes will automatically convert into shares of common stock, at the conversion price, if at any time during the term of the notes, commencing twelve (12) months from the date of issuance, the common stock trades minimum daily volume of at least 50,000 shares for twenty (20) consecutive days with a volume weighted average price of at least $4.00 per share. As of August 21, 2019, all remaining convertible debt and accrued interest had been converted to equity and no convertible debt remains outstanding.
During the three months ended March 31, 2019, 172,500 warrants issued in connection with the convertible debt were exercised, resulting in the issuance of 172,500 shares of common stock.
Amortization of debt discount for the three months ended March 31, 2019 was $124,946.
| 10. | SHARE BASED PAYMENTS AND STOCK OPTIONS |
The Company accounts for share-based payments through the measurement and recognition of compensation expense for share-based payment awards made to employees and directors of the Company, including stock options and restricted shares.
During the three months ended March 31, 2020 the Company issued 518,333 shares of common stock (stock-based awards) to officers and employees that vested immediately resulting in compensation expense of approximately $2,130,000. No stock-based awards were issued for the three months ended March 31, 2019 that vested immediately.
During the three months ended March 31, 2020 and March 31, 2019, the Company recorded $145,990 and $0, respectively, of share-based compensation to executives that is included in payroll and payroll tax liabilities.
The following table presents share-based payment expense and new shares issued for the three months ended March 31, 2020 and 2019.
| Three Months Ended March 31, | |||||||
| 2020 | 2019 | ||||||
| Total non-cash share-based compensation | $ | 4,115,068 | $ | 80,278 | |||
On March 6, 2014, the Company’s Board of Directors (the “Board”) approved the 2014 Equity Incentive Plan (“2014 Plan”) pursuant to which the Company may grant incentive, non-statutory options, stock appreciation rights, restricted stock, restricted stock units, performance shares, performance units and other stock or cash awards to employees, nonemployee members of our Board, consultants and other independent advisors who provide services to the Company. The maximum shares of common stock which may be issued over the term of the plan shall not exceed 2,500,000 shares. Awards under this plan are made by the Board or a committee designated by the Board. Options under the plan are to be issued at the market price of the stock on the day of the grant except to those issued to holders of 10% or more of the Company’s common stock which is required to be issued at a price not less than 110% of the fair market value on the day of the grant. Each option is exercisable at such time or times, during such period and for such numbers of shares shall be determined by the plan administrator. No option may be exercisable for more than ten years (five years in the case of an incentive stock option granted to a 10% stockholder) from the date of grant.
F-15
GrowGeneration Corporation and Subsidiaries
Notes to the Unaudited Consolidated Financial Statements
March 31, 2020
| 10. | SHARE BASED PAYMENTS AND STOCK OPTIONS, continued |
On January 7, 2018, the Board adopted the 2018 Equity Compensation Plan (the “2018 Plan”) and on April 20, 2018, the shareholders approved the 2018 Plan. On February 7, 2020, the Board approved the amendment and restatement of the 2018 Plan to increase the number of shares issuable thereunder from 2,500,000 to 5,000,000, which amendment was approved by shareholders on May 11, 2020. The 2018 Plan will be administered by the Board. The Board may grant options to purchase shares of common stock, stock appreciation rights, restricted stock units, restricted or unrestricted shares of common stock, performance shares, performance units, other cash-based awards and other stock-based awards. The Board also has broad authority to determine the terms and conditions of each option or other kind of equity award, adopt, amend and rescind rules and regulations for the administration of the 2018 Plan and amend or modify outstanding options, grants and awards.
No options, stock purchase rights or awards may be made under the 2018 Plan on or after the ten-year anniversary of the adoption of the 2018 Plan by the Board, but the 2018 Plan will continue thereafter while previously granted options, stock appreciation rights or awards remain subject to the 2018 Plan. Options granted under the 2018 Plan may be either “incentive stock options” that are intended to meet the requirements of Section 422 of the Internal Revenue Code of 1986, as amended (the “Code”) or “nonstatutory stock options” that do not meet the requirements of Section 422 of the Code. The Board will determine the exercise price of options granted under the 2018 Plan. The exercise price of stock options may not be less than the fair market value, on the date of grant, per share of our Common Stock issuable upon exercise of the option (or 110% of fair market value in the case of incentive options granted to a ten-percent stockholder). No option may be exercisable for more than ten years (five years in the case of an incentive stock option granted to a 10% stockholder) from the date of grant.
Awards issued under the 2014 Plan as of March 31, 2020 are summarized below:
| 2020 | ||||
| Total shares available for issuance pursuant to the 2014 Plan | 2,500,000 | |||
| Options outstanding, March 31, 2020 | (224,000 | ) | ||
| Total options exercised under 2014 Plan | (1,889,833 | ) | ||
| Total shares issued pursuant to the 2014 Plan | (375,000 | ) | ||
| Awards available for issuance under the 2014 Plan, March 31, 2020 | 11,167 | |||
Awards issued under the 2018 Plan as of March 31, 2020 are summarized below:
| 2020 | ||||
| Total shares available for issuance pursuant to the 2018 Plan, after amendment | 5,000,000 | |||
| Options outstanding, March 31, 2020 | (1,618,500 | ) | ||
| Total options exercised under 2018 Plan | (31,333 | ) | ||
| Total shares issued pursuant to the 2018 Plan | (69,750 | ) | ||
| Awards available for issuance under the 2018 Plan, March 31, 2020 | 3,280,417 | |||
F-16
GrowGeneration Corporation and Subsidiaries
Notes to the Unaudited Consolidated Financial Statements
March 31, 2020
| 10. | SHARE BASED PAYMENTS AND STOCK OPTIONS, continued |
The table below summarizes all the options granted by the Company under all plans during the three months ended March 31, 2020:
| Options | Shares | Weight - Average Exercise Price | Weighted - Average Remaining Contractual Term | Weighted - Average Grant Date Fair Value | ||||||||||
| Outstanding at December 31, 2019 | 1,916,333 | $ | 2.78 | 3.81 years | $ | 1.71 | ||||||||
| Granted | 607,500 | 3.92 | $ | 2.29 | ||||||||||
| Exercised | (414,663 | ) | $ | 1.83 | $ | .85 | ||||||||
| Forfeited or expired | - | |||||||||||||
| Outstanding at March 31, 2020 | 2,109,170 | $ | 2.97 | 3.01 years | $ | 1.88 | ||||||||
| Options vested at March 31, 2020 | 1,210,837 | $ | 2.74 | 2.68 years | $ | 1.66 | ||||||||
| 11. | STOCK PURCHASE WARRANTS |
A summary of the status of the Company’s outstanding stock purchase warrants as of March 31, 2020 is as follows:
| Warrants | Weighted - Average Exercise Price | |||||||
| Outstanding at December 31, 2019 | 3,697,686 | $ | 3.25 | |||||
| Issued | - | |||||||
| Exercised | (191,235 | ) | $ | 2.75 | ||||
| Forfeited | (250,000 | ) | 5.75 | |||||
| Outstanding at March 31, 2020 | 3,256,451 | $ | 3.08 | |||||
| 12. | EARNINGS PER SHARE |
Potentially dilutive securities, issued by the Company, were comprised of the following:
| March 31, 2020 | March 31, 2019 | |||||||
| Stock purchase warrants | 3,256,451 | 3,279,500 | ||||||
| Convertible debt warrants | 112,500 | 363,750 | ||||||
| Options | 2,109,170 | 1,775,500 | ||||||
| Total | 5,478,121 | 5,418,750 | ||||||
F-17
GrowGeneration Corporation and Subsidiaries
Notes to the Unaudited Consolidated Financial Statements
March 31, 2020
| 12. | EARNINGS PER SHARE, continued |
The following table sets forth the composition of the weighted average shares (denominator) used in the basic and dilutive earnings per share computation for the three months ended March 31, 2020 and 2019. Potentially dilutive securities were not included in the computation of diluted loss per share for the three months ended March 31, 2020, because to do so would have been anti-dilutive. Therefore, basic loss per share is the same as diluted loss per share.
| Three months ended | ||||||||
| March 31, 2020 | March 31, 2019 | |||||||
| Net income (loss) | $ | (2,093,518 | ) | $ | 229,421 | |||
| Weighted average shares outstanding, basic | 37,823,304 | 28,437,132 | ||||||
| Effect of dilutive common stock equivalents | - | 5,418,750 | ||||||
| Adjusted weighted average shares outstanding, dilutive | 37,823,304 | 33,855,882 | ||||||
| Basic income (loss) per shares | $ | (.055 | ) | $ | .01 | |||
| Dilutive income (loss) per share | $ | (.055 | ) | $ | .01 | |||
| 13. | ACQUISITIONS |
The Company is the largest chain of hydroponic garden centers in North America and is a leading marketer and distributor of nutrients, growing media, advanced indoor and greenhouse lighting, ventilation systems and accessories for hydroponic gardening. Our acquisition strategy is to acquire well established profitable hydroponic garden centers in markets where the Company does not have a market presence or in markets where it is increasing its market presence. The Company accounts for acquisitions in accordance with ASC 805 “Business Combinations.” Assets acquired and liabilities assumed are recorded in the accompanying consolidated balance sheets at their estimated fair values, as of the acquisition date. For all acquisitions, the preliminary allocation of the purchase price was based upon a preliminary valuation, and the Company’s estimates and assumptions are subject to change within the measurement period as valuations are finalized. The Company has not made any adjustments to the preliminary valuations.
On February 26, 2020 we acquired certain assets of Health & Harvest LLC in a transaction valued at approximately $2.85 million. Acquired goodwill of approximately $1,750,600 represents the value expected to rise from organic growth and an opportunity to expand into a well-established market for the Company. Cash consideration was funded from the Company’s existing working capital. Transaction costs incurred in connection with this acquisition were not significant.
The table below represents the allocation of the purchase price to the acquired net assets during the three months ended March 31, 2020.
| Health & Harvest LLC | ||||
| Inventory | $ | 1,052,500 | ||
| Prepaids and other current assets | - | |||
| Furniture and equipment | 50,000 | |||
| Right to use asset | 192,600 | |||
| Lease liability | (192,600 | ) | ||
| Goodwill | 1,750,600 | |||
| Total | $ | 2,852,500 | ||
F-18
GrowGeneration Corporation and Subsidiaries
Notes to the Unaudited Consolidated Financial Statements
March 31, 2020
| 14. | ACQUISITIONS, continued |
The table below represents the consideration paid for the net assets acquired in business combinations.
| Health & Harvest LLC | ||||
| Cash | $ | 1,750,000 | ||
| Common stock | 1,102,500 | |||
| Total | $ | 2,852,500 | ||
The following table discloses the date of the acquisitions noted above and the revenue and earnings included in the consolidated income statement from the date of acquisition to the period ended March 31, 2020.
| Health & Harvest LLC | ||||
| Acquisition date | 2/26/2020 | |||
| Revenue | $ | 559,340 | ||
| Earnings | $ | 112,882 | ||
The following represents the pro forma consolidated income statement as if the acquisitions had been included in the consolidated results of the Company for the entire period for the three months ended March 31, 2019.
Pro forma consolidated income statement:
| March 31, 2019 | ||||
| Revenue | $ | 1,365,700 | ||
| Earnings | $ | 19,200 | ||
The table below represents the allocation of the preliminary purchase price to the acquired net assets during the three months ended March 31, 2019.
| Chlorophyll | Reno Hydroponics | Palm Springs Hydroponics | Total | |||||||||||||
| Inventory | $ | 1,441,000 | $ | 238,000 | $ | 465,500 | $ | 2,144,500 | ||||||||
| Prepaids and other current assets | 22,000 | - | 22,000 | |||||||||||||
| Furniture and equipment | 100,000 | 25,000 | 25,000 | 150,000 | ||||||||||||
| Right to use asset | 702,000 | - | 329,300 | 1,031,300 | ||||||||||||
| Lease liability | (702,000 | ) | - | (329,300 | ) | (1,031,300 | ) | |||||||||
| Goodwill | 2,596,100 | 516,300 | 554,000 | 3,666,400 | ||||||||||||
| Total | $ | 4,159,100 | $ | 779,300 | $ | 1,044,500 | $ | 5,982,900 | ||||||||
F-19
GrowGeneration Corporation and Subsidiaries
Notes to the Unaudited Consolidated Financial Statements
March 31, 2020
| 14. | ACQUISITIONS, continued |
The table below represents the consideration paid for the net assets acquired in business combinations for the period ended March 31, 2019.
| Chlorophyll | Reno Hydroponics | Palm Springs Hydroponics | Total | |||||||||||||
| Cash | $ | 3,659,100 | $ | 525,000 | $ | 800,000 | $ | 4,984,100 | ||||||||
| Common stock | 500,000 | 254,300 | 244,500 | 998,800 | ||||||||||||
| Total | $ | 4,159,100 | $ | 779,300 | $ | 1,044,500 | $ | 5,982,900 | ||||||||
The following table discloses the date of the acquisitions noted above and the revenue and earnings included in the consolidated income statement from the date of acquisition to the period ended March 31, 2019.
| Chlorophyll | Reno Hydroponics | Palm Springs Hydroponics | Total | |||||||||||||
| Acquisition date | 1/21/2019 | 2/11/2019 | 2/7/2019 | |||||||||||||
| Revenue | $ | 3,450,600 | $ | 1,594,900 | $ | 121,500 | $ | 5,167,000 | ||||||||
| Earnings | $ | 613,000 | $ | 165,300 | $ | 5,800 | $ | 784,100 | ||||||||
The following represents the proforma consolidated income statement as if the acquisitions had been included in the consolidated results of the Company for the entire period for the three months ended March 31, 2018.
Pro forma consolidated income statement
| March 31, 2018 | ||||
| Revenue | $ | 2,088,200 | ||
| Earnings | $ | 389,100 | ||
| 15. | SUBSEQUENT EVENTS |
The Company has evaluated events and transaction occurring subsequent to March 31, 2020 up to the date of this filing of these consolidated financial statements. These statements contain all necessary adjustments and disclosures resulting from that evaluation.
F-20

REPORT OF INDEPENDENT REGISTERED PUBLIC ACCOUNTING FIRM
To the Board of Directors and
Stockholders of GrowGeneration Corp
Opinion on the Financial Statements
We have audited the accompanying consolidated balance sheets of GrowGeneration Corp and Subsidiaries (the Company) as of December 31, 2019 and 2018, and the related consolidated statements of operations, stockholder s’ equity, and cash flows for each of the years in the two-year period ended December 31, 2019, and the related notes (collectively referred to as the financial statements). In our opinion, the financial statements present fairly, in all material respects, the financial position of the Company as of December 31, 2019 and 2018, and the results of its operations and its cash flows for each of the years in the two-year period ended December 31, 2019, in conformity with accounting principles generally accepted in the United States of America.
Basis for Opinion
These financial statements are the responsibility of the Company’s management. Our responsibility is to express an opinion on the Company’s financial statements based on our audits. We are a public accounting firm registered with the Public Company Accounting Oversight Board (United States) (PCAOB) and are required to be independent with respect to the Company in accordance with the U.S. federal securities laws and the applicable rules and regulations of the Securities and Exchange Commission and the PCAOB.
We conducted our audits in accordance with the standards of the PCAOB. Those standards require that we plan and perform the audit to obtain reasonable assurance about whether the consolidated financial statements are free of material misstatement, whether due to error or fraud. The Company is not required to have, nor were we engaged to perform, an audit of its internal control over financial reporting. As part of our audits, we are required to obtain an understanding of internal control over financial reporting, but not for the purpose of expressing an opinion on the effectiveness of the Company’s internal control over financial reporting. Accordingly, we express no such opinion.
Our audits included performing procedures to assess the risks of material misstatement of the financial statements, whether due to error or fraud, and performing procedures that respond to those risks. Such procedures included examining, on a test basis, evidence regarding the amounts and disclosures in the consolidated financial statements. Our audits also included evaluating the accounting principles used and significant estimates made by management, as well as evaluating the overall presentation of the financial statements. We believe that our audits provide a reasonable basis for our opinion.
/s/ Connolly Grady & Cha, P.C
Certified Public Accountants
We have served as the Company’s auditor since 2014
Springfield, Pennsylvania
March 27, 2020
F-21
GrowGeneration Corp. and Subsidiaries
CONSOLIDATED BALANCE SHEETS
| December 31, 2019 | December 31, 2018 | |||||||
| ASSETS | ||||||||
| Current assets: | ||||||||
| Cash | $ | 12,979,444 | $ | 14,639,981 | ||||
| Accounts receivable, net of allowance for doubtful accounts of $291,372 and $133,288 at December 31, 2019 and 2018 | 4,455,209 | 862,397 | ||||||
| Inventory | 22,659,357 | 8,869,469 | ||||||
| Prepaids and other current assets | 2,549,559 | 606,037 | ||||||
| Total current assets | 42,643,569 | 24,977,884 | ||||||
| Property and equipment, net | 3,340,616 | 1,820,821 | ||||||
| Operating leases right-of-use assets, net | 7,628,591 | - | ||||||
| Intangible assets, net | 233,280 | 114,155 | ||||||
| Goodwill | 17,798,932 | 8,752,909 | ||||||
| Other assets | 377,364 | 227,205 | ||||||
| TOTAL ASSETS | $ | 72,022,352 | $ | 35,892,974 | ||||
| LIABILITIES & STOCKHOLDERS’ EQUITY | ||||||||
| Current liabilities: | ||||||||
| Accounts payable | $ | 6,024,750 | $ | 1,819,411 | ||||
| Accrued liabilities | - | 40,151 | ||||||
| Payroll and payroll tax liabilities | 1,072,142 | 410,345 | ||||||
| Customer deposits | 2,503,785 | 516,038 | ||||||
| Sales tax payable | 533,656 | 191,958 | ||||||
| Current maturities of right-of-use assets | 1,836,700 | - | ||||||
| Current portion of long-term debt | 110,231 | 436,813 | ||||||
| Total current liabilities | 12,081,264 | 3,414,716 | ||||||
| Long-term convertible debt, net of debt discount and debt issuance costs | - | 2,044,113 | ||||||
| Operating leases right-of-use assets, net of current maturities | 5,807,266 | - | ||||||
| Long-term debt, net of current portion | 242,079 | 375,626 | ||||||
| Total liabilities | 18,130,609 | 5,834,455 | ||||||
| Commitments and contingencies | ||||||||
| Stockholders’ Equity: | ||||||||
| Common stock; $.001 par value; 100,000,000 shares authorized; 36,876,305 and 27,948,609 shares issued and outstanding as of December 31, 2019 and 2018, respectively | 36,876 | 27,949 | ||||||
| Additional paid-in capital | 60,742,055 | 38,796,562 | ||||||
| Accumulated deficit | (6,887,188 | ) | (8,765,992 | ) | ||||
| Total stockholders’ equity | 53,891,743 | 30,058,519 | ||||||
| TOTAL LIABILITIES AND STOCKHOLDERS’ EQUITY | $ | 72,022,352 | $ | 35,892,974 | ||||
The accompanying notes are an integral part of these audited consolidated financial statements.
F-22
GrowGeneration Corp. and Subsidiaries
CONSOLIDATED STATEMENTS OF OPERATIONS
| For the Years Ended December 31, | ||||||||
| 2019 | 2018 | |||||||
| Sales | $ | 79,733,568 | $ | 29,000,730 | ||||
| Cost of sales | 57,171,721 | 22,556,172 | ||||||
| Gross profit | 22,561,847 | 6,444,558 | ||||||
| Operating expenses: | ||||||||
| Store operations | 10,095,422 | 5,202,330 | ||||||
| General and administrative | 3,172,019 | 1,603,421 | ||||||
| Share based compensation | 2,490,535 | 1,895,219 | ||||||
| Depreciation and amortization | 1,044,553 | 351,070 | ||||||
| Salaries and related expenses | 3,619,197 | 1,648,166 | ||||||
| Total operating expenses | 20,421,726 | 10,700,206 | ||||||
| Net income (loss) from operations | 2,140,121 | (4,255,648 | ) | |||||
| Other income (expense): | ||||||||
| Miscellaneous income (expense) | (4,545 | ) | 115,875 | |||||
| Interest income | 144,725 | 79,184 | ||||||
| Interest expense | (45,191 | ) | (23,565 | ) | ||||
| Amortization of debt discount | (356,306 | ) | (989,601 | ) | ||||
| Total non-operating income (expense), net | (261,317 | ) | (818,107 | ) | ||||
| Net income (loss) | $ | 1,878,804 | $ | (5,073,755 | ) | |||
| Net income (loss) per share, basic | $ | .06 | $ | (.22 | ) | |||
| Net income (loss) per share, diluted | $ | .05 | $ | (.22 | ) | |||
| Weighted average shares outstanding, basic | 32,833,594 | 23,492,650 | ||||||
| Weighted average shares outstanding, diluted | 39,228,696 | 23,492,650 | ||||||
The accompanying notes are an integral part of these audited consolidated financial statements.
F-23
GrowGeneration Corp. and Subsidiaries
CONSOLIDATED STATEMENTS OF STOCKHOLDERS’ EQUITY
FOR THE YEARS ENDED DECEMBER 31, 2019 and 2018
| Additional | Total | |||||||||||||||||||
| Common Stock | Paid-In | Accumulated | Stockholders’ | |||||||||||||||||
| Shares | Amount | Capital | (Deficit) | Equity | ||||||||||||||||
| Balances, December 31, 2017 | 16,846,835 | $ | 16,846 | $ | 11,254,212 | $ | (3,692,237 | ) | $ | 7,578,821 | ||||||||||
| Sale of Common stock and warrants, net of fees | 3,333,333 | 3,333 | 9,956,544 | - | 9,959,877 | |||||||||||||||
| Warrants issued for services | - | - | 456,807 | - | 456,807 | |||||||||||||||
| Stock option expense | - | - | 546,370 | - | 546,370 | |||||||||||||||
| Common stock issued upon warrant exercise | 3,076,461 | 3,077 | 2,590,617 | - | 2,593,694 | |||||||||||||||
| Common stock issued upon exercise of options | 995,186 | 995 | 320,706 | - | 321,701 | |||||||||||||||
| Common stock issued in connection with business combinations | 1,550,000 | 1,550 | 5,303,600 | - | 5,305,150 | |||||||||||||||
| Common stock issued upon conversion of convertible debt | 2,013,294 | 2,014 | 3,619,917 | - | 3,621,931 | |||||||||||||||
| Warrants issued with convertible debt | - | - | 4,239,000 | - | 4,239,000 | |||||||||||||||
| Common stock issued for services | 107,500 | 108 | 400,395 | - | 400,503 | |||||||||||||||
| Common stock issued for accrued share-based compensation | 26,000 | 26 | 108,394 | - | 108,420 | |||||||||||||||
| Net loss | (5,073,755 | ) | (5,073,755 | ) | ||||||||||||||||
| Balances, December 31, 2018 | 27,948,609 | $ | 27,949 | 38,796,562 | $ | (8,765,992 | ) | $ | 30,058,519 | |||||||||||
| Sale of Common stock and warrants, net of fees | 4,123,254 | 4,123 | 12,639,510 | - | 12,643,633 | |||||||||||||||
| Share based compensation | 1,215,273 | 1,215,273 | ||||||||||||||||||
| Common stock issued upon warrant exercise | 1,757,913 | 1,758 | 1,298,141 | 1,299,899 | ||||||||||||||||
| Common stock issued upon exercise of options | 10,000 | 10 | 5,990 | 6,000 | ||||||||||||||||
| Common stock issued upon cashless exercise of options | 505,868 | 506 | (506 | ) | - | |||||||||||||||
| Common stock issued in connection with business combinations | 969,553 | 969 | 3,624,411 | - | 3,625,380 | |||||||||||||||
| Common stock issued upon conversion of convertible debt | 1,258,608 | 1,259 | 2,404,010 | 2,405,269 | ||||||||||||||||
| Common stock issued for services | 202,500 | 202 | 548,564 | 548,766 | ||||||||||||||||
| Common stock issued for accrued share-based compensation | 100,000 | 100 | 210,100 | 210,200 | ||||||||||||||||
| Net income | 1,878,804 | 1,878,804 | ||||||||||||||||||
| Balances, December 31, 2019 | 36,876,305 | $ | 36,876 | $ | 60,742,055 | $ | (6,887,188 | ) | $ | 53,891,743 | ||||||||||
The accompanying notes are an integral part of theses audited consolidated financial statements.
F-24
GrowGeneration Corp. and Subsidiaries
CONSOLIDATED STATEMENTS OF CASH FLOWS
| Years Ended December 31, | ||||||||
| 2019 | 2018 | |||||||
| Cash Flows from Operating Activities: | ||||||||
| Net income (loss) | $ | 1,878,804 | $ | (5,073,755 | ) | |||
| Adjustments to reconcile net income (loss) to net cash used in operating activities: | ||||||||
| Depreciation and amortization | 1,044,553 | 351,069 | ||||||
| Provision for doubtful accounts receivable | 172,135 | 35,459 | ||||||
| Inventory valuation reserve | 429,126 | 153,397 | ||||||
| Amortization of debt discount | 356,306 | 989,601 | ||||||
| Stock based compensation | 2,490,535 | 1,895,219 | ||||||
| Noncash operating lease expense | 15,375 | - | ||||||
| Other | (66,536 | ) | - | |||||
| Changes in operating assets and liabilities: | ||||||||
| (Increase) decrease in: | ||||||||
| Accounts receivable | (3,764,947 | ) | (244,288 | ) | ||||
| Inventory | (10,482,014 | ) | (792,575 | ) | ||||
| Prepaid expenses and other assets | (2,061,701 | ) | (182,616 | ) | ||||
| Increase (decrease) in: | ||||||||
| Accounts payable and accrued liabilities | 4,165,188 | 514,154 | ||||||
| Customer deposits | 1,987,747 | 423,688 | ||||||
| Payroll and payroll tax liabilities | 154,471 | 270,878 | ||||||
| Sales taxes payable | 341,698 | 118,738 | ||||||
| Net Cash (Used In) Operating Activities | (3,339,260 | ) | (1,541,031 | ) | ||||
| Cash Flows from Investing Activities: | ||||||||
| Assets acquired in business combinations | (9,458,743 | ) | (5,680,409 | ) | ||||
| Purchase of property and equipment | (2,232,812 | ) | (625,379 | ) | ||||
| Purchase of goodwill and other intangibles | (119,125 | ) | (61,523 | ) | ||||
| Net Cash (Used In) Investing Activities | (11,810,680 | ) | (6,367,311 | ) | ||||
| Cash Flows from Financing Activities: | ||||||||
| Principal payments on long term debt | (460,129 | ) | (454,979 | ) | ||||
| Proceeds from issuance of convertible debt, net of expenses | - | 8,912,765 | ||||||
| Proceeds from the sales of common stock and exercise of warrants and options, net of expenses | 13,949,532 | 12,875,272 | ||||||
| Net Cash Provided by Financing Activities | 13,489,403 | 21,333,058 | ||||||
| Net Increase(decrease) in Cash and Cash Equivalents | (1,660,537 | ) | 13,424,716 | |||||
| Cash and Cash Equivalents at Beginning of year | 14,639,981 | 1,215,265 | ||||||
| Cash and Cash Equivalents at End of year | $ | 12,979,444 | $ | 14,639,981 | ||||
| Supplemental Information: | ||||||||
| Common stock and warrants issued for prepaid services | $ | 96,000 | $ | 45,000 | ||||
| Common stock issued for accrued payroll liability | 210,200 | - | ||||||
| Debt converted to Equity | 2,310,832 | 3,621,931 | ||||||
| Assets acquired by issuance of stock | 3,625,380 | 5,305,150 | ||||||
| Warrants issued for debt discount | - | 4,239,000 | ||||||
| Acquisition of vehicles with debt financing | - | 56,174 | ||||||
| Interest paid during the period | $ | 45,191 | $ | 23,565 | ||||
| Acquisition of assets with seller financing | - | 1,087,000 | ||||||
The accompanying notes are an integral part of these audited consolidated financial statements.
F-25
GROWGENERATION CORP. AND SUBSIDIARIES
NOTES TO CONSOLIDATED FINANCIAL STATEMENTS
FOR THE YEARS ENDED DECEMBER 31, 2019 and 2018
| 1. | NATURE OF OPERATIONS |
GrowGeneration Corp (the “Company”) was incorporated on March 6, 2014 in Colorado under the name of Easylife Corp and changed its name to GrowGeneration Corp. It maintains its principal office in Denver, Colorado.
GrowGeneration is the largest chain of hydroponic garden centers in North America and is a leading marketer and distributor of nutrients, growing media, advanced indoor and greenhouse lighting, ventilation systems and accessories for hydroponic gardening. As of March 27, 2020, the Company owns and operates a chain of twenty seven (27) retail hydroponic/gardening stores, with five (5) located in the state of Colorado, four (4) in the state of California, four (4) in the state of Michigan, two (2) in the state of Nevada, one (1) in the state of Washington, one (1) in the state of Oregon, four (4) in the State of Oklahoma, one (1) in the state of Rhode Island, three (3) in Maine, (1) in Florida, one (1) distribution center in California and an online e-commerce store, GrowGen.Pro. In addition, we operate a warehouse out of Sacramento, CA. Our plan is to acquire, open and operate hydroponic/gardening stores and related businesses throughout the United States and Canada.
The Company engages in its business through its wholly owned subsidiaries, GrowGeneration Pueblo Corp, GrowGeneration California Corp, Grow Generation Nevada Corp, GrowGeneration Washington Corp, GrowGeneration Rhode Island Corp, GrowGeneration Oklahoma Corp, GrowGeneration Canada, GrowGeneration HG Corp, GrowGeneration Hemp Corp, GGen Distribution Corp, GrowGeneration Michigan Corp, GrowGeneration New England Corp, GrowGeneration Florida Corp and GrowGeneration Management Corp.
| 2. | SUMMARY OF SIGNIFICANT ACCOUNTING POLICIES |
Basis of Presentation and Consolidation
The financial statements are prepared under the Financial Accounting Standards Board (“FASB”) Accounting Standards Codification (“ASC”) Topic 105-10, Generally Accepted Accounting Principles, in accordance with accounting principles generally accepted in the U.S. (“GAAP”).
The consolidated financial statements include the Company and its wholly-owned subsidiaries. All intercompany balances and transactions are eliminated in consolidation.
Reclassifications
Certain amounts in the prior period financial statements have been reclassified to conform to the current period presentation. These reclassifications had no effect on reported consolidated net income (loss).
Use of Estimates
Management uses estimates and assumptions in preparing these consolidated financial statements in accordance with generally accepted accounting principles. These estimates and assumptions affect the reported amounts of assets and liabilities, the disclosure of contingent assets and liabilities at the date of the consolidated financial statements, and the reported revenues and expenses during the reporting period. Actual results could vary from the estimates that were used.
Segment Reporting
Management makes significant operating decisions based upon the analysis of the entire Company and financial performance is evaluated on a company-wide basis. Accordingly, the various products sold are aggregated into one reportable operating segment as under guidance in the Financial Accounting Standards Board (the “FASB”) Accounting Standards Codification (“ASC or codification”) Topic 280 for segment reporting.
F-26
GROWGENERATION CORP. AND SUBSIDIARIES
NOTES TO CONSOLIDATED FINANCIAL STATEMENTS
FOR THE YEARS ENDED DECEMBER 31, 2019 and 2018
| 2. | SUMMARY OF SIGNIFICANT ACCOUNTING POLICIES (Continued) |
Revenue Recognition
The Company recognizes revenue, net of estimated returns and sales tax, at the time the customer takes possession of merchandise or receives services. When the Company receives payment from customers before the customer has taken possession of the merchandise or the service has been performed, the amount received is recorded as Deferred Revenue in the accompanying Consolidated Balance Sheets until the sale or service is complete.
Vendor Allowances
Vendor allowances primarily consist of volume rebates that are earned as a result of attaining certain purchase levels. These vendor allowances are accrued as earned, with those allowances received as a result of attaining certain purchase levels accrued over the incentive period based on estimates of purchases.
Volume rebates, when earned, are recorded as a reduction in Cost of Sales.
Cash Equivalents
The Company considers all highly liquid investments purchased with original maturities of three months or less to be cash equivalents. The Company’s cash equivalents are carried at fair market value and consist primarily of money market funds.
Accounts Receivable
Accounts receivable are stated at the amount the Company expects to collect from balances outstanding at year-end, based on the Company’s assessment of the credit history with customers having outstanding balances and current relationships with them. A reserve for uncollectable receivables is established when collection of amounts due is deemed improbable. Indicators of improbable collection include client bankruptcy, client litigation, client cash flow difficulties or ongoing service or billing disputes. Credit is generally extended on a short-term basis thus receivables do not bear interest. At December 31, 2019 and 2018, the Company established an allowance for doubtful accounts of $291,372 and $133,288, respectively.
Inventory
Inventory consists primarily of gardening supplies and materials and is recorded at the lower of cost (first-in, first-out method) or market. The company periodically reviews the value of items in inventory and provides write-downs or write-offs of inventory based on its assessment of market conditions. Write-downs and write-offs are charged to cost of goods sold.
Property and Equipment
Property and equipment are carried at cost. Leasehold Improvements are amortized using the straight-line method over the original term of the lease or the useful life of the improvement, whichever is shorter. Renewals and betterment that materially extend the life of the asset are capitalized. Expenditures for maintenance and repairs are charged against operations. Depreciation of property and equipment is provided on the straight-line method for financial reporting purposes at rates based on the following estimated useful lives:
| Estimated Lives | ||
| Vehicle | 5 years | |
| Furniture and fixtures | 5-7 years | |
| Computers and equipment | 3-5 years | |
| Leasehold improvements | 10 years not to exceed lease term |
F-27
GROWGENERATION CORP. AND SUBSIDIARIES
NOTES TO CONSOLIDATED FINANCIAL STATEMENTS
FOR THE YEARS ENDED DECEMBER 31, 2019 and 2018
| 2. | SUMMARY OF SIGNIFICANT ACCOUNTING POLICIES (Continued) |
Leases
We assess whether an arrangement is a lease at inception. Leases with an initial term of 12 months or less are not recorded on the balance sheet. We have elected the practical expedient to not separate lease and non-lease components for all assets. Operating lease assets and operating lease liabilities are calculated based on the present value of the future minimum lease payments over the lease term at the lease start date. As most of our leases do not provide an implicit rate, we use our incremental borrowing rate based on the information available at the lease start date in determining the present value of future payments. The operating lease asset is increased by any lease payments made at or before the lease start date and reduced by lease incentives and initial direct costs incurred. The lease term includes options to renew or terminate the lease when it is reasonably certain that we will exercise that option. The exercise of lease renewal options is at our sole discretion. The depreciable life of lease assets and leasehold improvements are limited by the lease term. Lease expense for operating leases is recognized on a straight-line basis over the lease term.
Fair Value of Financial Instruments
The fair value of certain of our financial instruments including cash and cash equivalents, accounts receivable, prepaid assets, employee advances, accounts payable, customer deposits, payroll and payroll tax liabilities, sales tax payable and notes payable approximate their carrying amounts because of the short-term maturity of these instruments.
Income Taxes
The Company accounts for income taxes in accordance with FASB ASC 740, Income Taxes, which requires the recognition of deferred income taxes for differences between the basis of assets and liabilities for financial statement and income tax purposes. The differences relate principally to depreciation of property and equipment, reserve for obsolete inventory and bad debt. Deferred tax assets and liabilities represent the future tax consequence for those differences, which will either be deductible or taxable when the assets and liabilities are recovered or settled. Deferred taxes are also recognized for operating losses that are available to offset future taxable income. Valuation allowances are established to reduce deferred tax assets to the amount expected to be realized.
The Company adopted the provisions of FASB ASC 740-10-25, which prescribes a recognition threshold and measurement attribute for the recognition and measurement of tax positions taken or expected to be taken in income tax returns. FASB ASC 740-10-25 also provides guidance on de-recognition of income tax assets and liabilities, classification of current and deferred income tax assets and liabilities, and accounting for interest and penalties associated with tax positions. The Company’s tax returns are subject to tax examinations by U.S. federal and state authorities until respective statute of limitation. Currently, the 2018, 2017, and 2016 tax years are open and subject to examination by taxing authorities. However, the Company is not currently under audit nor has the Company been contacted by any of the taxing authorities. The Company does not have any accruals for uncertain tax positions as of December 31, 2019. It is not anticipated that unrecognized tax benefits would significantly increase or decrease within 12 months of the reporting date.
Concentration of Risk
Financial instruments that potentially expose us to concentrations of risk consist primarily of cash and cash equivalents and accounts receivable, which are generally not collateralized. Our policy is to place our cash and cash equivalents with high quality financial institutions, in order to limit the amount of credit exposure. Accounts at each institution are insured by the Federal Deposit Insurance Corporation (FDIC), up to $250,000. At December 31, 2019 and 2018, the Company had $11,229,444 and $12,962,958, respectively, in excess of the FDIC insurance limit. The Company generally does not require collateral from its customers, but its credit extension and collection policies include analyzing the financial condition of potential customers, establishing credit limits, monitoring payments, and aggressively pursuing delinquent accounts. The Company maintains allowance for potential credit losses.
F-28
GROWGENERATION CORP. AND SUBSIDIARIES
NOTES TO CONSOLIDATED FINANCIAL STATEMENTS
FOR THE YEARS ENDED DECEMBER 31, 2019 and 2018
| 2. | SUMMARY OF SIGNIFICANT ACCOUNTING POLICIES (Continued) |
Advertising
The Company expenses advertising and promotional costs when incurred. Advertising and promotional expenses for the years ended December 31, 2019 and 2018 amounted to $736,656 and $269,550, respectively.
Goodwill
Goodwill represents the excess of purchase price over the fair value of net assets. The Company accounts for goodwill in accordance with the provisions of FASB Accounting Standards Update (ASU) 2014-02, Intangibles – Goodwill and Other (Topic 350) Accounting for Goodwill. In accordance with FASB ASC Topic 350 for Intangibles – Goodwill and Other, goodwill is not amortized but is reviewed for potential impairment on an annual basis, or if events or circumstances indicate a potential impairment, at the reporting unit level. The Company’s review for impairment includes an assessment of qualitative factors to determine whether it is more likely than not that the fair value of a reporting unit is less than its´ carrying value, including goodwill. If it is determined that it is more likely than not that the fair value of a reporting unit is less than its´ carrying value, including goodwill, the first step of the two-step quantitative goodwill impairment test is performed, which compares the fair value of the reporting unit with its´ carrying amounts, including goodwill. If the fair value of the reporting unit exceeds its´ carrying amount, goodwill of the reporting unit is considered not impaired. However, if the carrying amount of the reporting unit exceeds its fair value, additional procedures must be performed. That additional procedure compares the implied fair value of the reporting unit’s goodwill with the carrying amount of that goodwill. An impairment loss is recorded to the extent that the carrying amount of goodwill exceeds its implied fair value.
Earnings (Loss) Per Share
The Company computes net earnings (loss) per share under Accounting Standards Codification subtopic 260-10, “Earnings Per Share” (“ASC 260-10”). Basic earnings or loss per share (“EPS”) is computed by dividing net income (loss) available to common stockholders by the weighted average number of common shares outstanding for the period. Diluted EPS is computed by dividing net income (loss) by the weighted-average of all potentially dilutive shares of common stock that were outstanding during the periods presented.
The treasury stock method is used in calculating diluted EPS for potentially dilutive stock options and share purchase warrants, which assumes that any proceeds received from the exercise of in-the-money stock options and share purchase warrants, would be used to purchase common shares at the average market price for the period.
Stock Based Compensation
The Company records stock-based compensation in accordance with FASB ASC Topic 718, Compensation-Stock Compensation (“ASC 718”). The Company estimates the fair value of stock options using the Black-Scholes option pricing model. The fair value of stock options granted is recognized as an expense over the requisite service period. Stock-based compensation expense for all share-based payment awards are recognized using the straight-line single-option method.
The Black-Scholes option pricing model requires subjective assumptions, including future stock price volatility and expected time to exercise, which greatly affect the calculated values. The expected term of options granted is derived from historical data on employee exercises and post-vesting employment termination behavior. The risk-free rate selected to value any particular grant is based on the U.S. Treasury rate that corresponds to the expected life of the grant effective as of the date of the grant. The expected volatility is based on the historical volatility of the Company’s stock price. These factors could change in the future, affecting the determination of stock-based compensation expense in future periods.
F-29
GROWGENERATION CORP. AND SUBSIDIARIES
NOTES TO CONSOLIDATED FINANCIAL STATEMENTS
FOR THE YEARS ENDED DECEMBER 31, 2019 and 2018
| 3. | RECENT ACCOUNTING PRONOUNCEMENTS |
From time to time, the Financial Accounting Standards Board (“FASB”) or other standard setting bodies issue new accounting pronouncements. Updates to the FASB Accounting Standards Codification are communicated through issuance of an Accounting Standards Update (“ASU”). We have implemented all new accounting pronouncements that are in effect and that may impact our financial statements. We have evaluated recently issued accounting pronouncements and determined that there is no material impact on our financial position or results of operations.
Recently Adopted Accounting Pronouncements
During the first quarter of 2019, the Company adopted the Financial Accounting Standards Board (FASB) Accounting Standards Update (ASU) 2016-02, Leases (ASC 842), which introduces the balance sheet recognition of lease assets and lease liabilities by lessees for those leases classified as operating leases under previous guidance. The Company has adopted the new lease standard using the new transition option issued under the amendments in ASU 2018-11, Leases, which allowed the Company to continue to apply the legacy guidance in Accounting Standards Codification (ASC) 840, Leases, in the comparative periods presented in the year of adoption. The Company elected the package of practical expedients permitted under the transition guidance within the new standard, which among other things, allowed the Company to carry forward the historical lease classification. The Company made an accounting policy election to keep leases with an initial term of 12 months or less off the balance sheet. The Company will recognize those lease payments on a straight-line basis over the lease term. The impact of the adoption was an increase to the Company’s operating lease assets and liabilities on January 1, 2019 of $3.2 million.
On January 1, 2019, the Company also adopted ASU 2018-07, “Improvements to Nonemployee Share-Based Payment Accounting.” ASU 2018-07 more closely aligns the accounting for employee and nonemployee share-based payments. The amendment is effective commencing in 2019 with early adoption permitted. The adoption of this new guidance did not have a material impact on our Financial Statements.
In August 2018, the SEC adopted amendments to certain disclosure requirements in Securities Act Release No. 33-10532, Disclosure Update and Simplification. These amendments eliminate, modify, or integrate into other SEC requirements certain disclosure rules. Among the amendments is the requirement to present an analysis of changes in stockholders’ equity in the interim financial statements included in Quarterly Reports on Form 10-Q. The analysis, which can be presented as a footnote or separate statement, is required for the current and comparative quarter and year-to-date interim periods. The amendments are effective for all filings made on or after November 5, 2018. The Company adopted these amendments in its Quarterly Report on Form 10-Q for the quarter ended September 30, 2019.
In January 2016, the FASB issued ASU 2016-01, Financial Instruments-Overall: Recognition and Measurement of Financial Assets and Financial Liabilities, which requires that (i) all equity investments, other than equity-method investments, in unconsolidated entities generally be measured at fair value through earnings and (ii) when the fair value option has been elected for financial liabilities, changes in fair value due to instrument-specific credit risk will be recognized separately in other comprehensive income. Additionally, the ASU 2016-01 changes the disclosure requirements for financial instruments. The new standard was effective for the Company starting in the first quarter of fiscal 2019. The adoption of this standard on January 1, 2019 did not have any effect on the consolidated financial statements and footnote disclosure.
On August 28, 2017, the FASB issued ASU 2017-12, “Derivatives and Hedging,” which better aligns risk management activities and financial reporting for hedging relationships through changes to both the designation and measurement guidance for qualifying hedging relationships and the presentation of hedge results. The amendments expand and refine hedge accounting for both nonfinancial and financial risk components and in some situations better align the recognition and presentation of the effects of the hedging instrument and the hedged item in the financial statements. The new standard was effective for the Company as of January 1, 2019. The adoption of this new standard on January 1, 2019 did not have any impact on our consolidated financial statements and footnote disclosures.
F-30
GROWGENERATION CORP. AND SUBSIDIARIES
NOTES TO CONSOLIDATED FINANCIAL STATEMENTS
FOR THE YEARS ENDED DECEMBER 31, 2019 and 2018
| 3. | RECENT ACCOUNTING PRONOUNCEMENTS, Continued |
Recently Issued Accounting Pronouncements – Pending Adoption
In June 2016, the FASB issued ASU 2016-13, Financial Instruments-Credit Losses: Measurement of Credit Losses on Financial Instruments, which changes the impairment model for most financial assets and certain other instruments. For trade receivables and other instruments, entities will be required to use a new forward-looking expected loss model that generally will result in the earlier recognition of allowances for losses. For available-for-sale debt securities with unrealized losses, the losses will be recognized as allowances rather than as reductions in the amortized cost of the securities. This guidance is effective for annual reporting periods beginning after December 15, 2019, including interim periods within those years, with early adoption permitted only as of annual reporting periods beginning after December 15, 2018. The Company is currently evaluating the impact of the adoption of this guidance on the Company’s consolidated financial statements.
In August 2018, the FASB issued ASU 2018-13, Fair Value Measurement (Topic 820): Disclosure Framework - Changes to the Disclosure Requirements for Fair Value Measurement. The new guidance modifies the disclosure requirements on fair value measurements in Topic 820. The amendments in ASU 2018-13 are effective for all entities for fiscal years, and interim periods within those fiscal years, beginning after December 15, 2019. The Company does not anticipate that the adoption of ASU 2018-13 will have a material impact on the Company’s consolidated financial statements or related financial statement disclosures.
| 4. | PROPERTY AND EQUIPMENT |
Property and equipment at December 31, 2019 and 2018 consists of the following:
| December 31, | ||||||||
| 2019 | 2018 | |||||||
| Vehicle | $ | 1,148,993 | $ | 535,857 | ||||
| Leasehold improvements | 884,685 | 441,725 | ||||||
| Furniture, fixtures and equipment | 2,858,777 | 1,417,061 | ||||||
| 4,892,455 | 2,394,643 | |||||||
| Accumulated depreciation and amortization | (1,551,839 | ) | (573,822 | ) | ||||
| Property and equipment, net | $ | 3,340,616 | $ | 1,820,821 | ||||
Depreciation expense was $1,046,328 and $350,415 for the years ended December 31, 2019 and 2018, respectively.
| 5. | INCOME TAXES |
On December 22, 2017, the U.S. President signed into law H.R.1, formerly known as the Tax Cuts and Jobs Act (the “Tax Legislation”). The Tax Legislation significantly revised the U.S. tax code by, (i) lowering the U.S federal statutory income tax rate from 35% to 21%, (ii) implementing a territorial tax system, (iii) imposing a one-time transition tax on deemed repatriated earnings of foreign subsidiaries (“Transition Tax”), (iv) requiring a current inclusion of global intangible low taxed income (“GILTI”) of certain earnings of controlled foreign corporations in U.S. federal taxable income, (v) creating the base erosion anti-abuse tax (“BEAT”) regime, (vi) implementing bonus depreciation that will allow for full expensing of qualified property, and (vii) limiting deductibility of interest and executive compensation expense, among other changes. The Company has computed its 2018 current tax benefit using the U.S. federal statutory rates of 21% while it has computed its deferred tax expense using the new statutory rate effective on January 1, 2018 of 21%.
Other provisions of the new legislation that were not applicable to the Company until the year ended December 31, 2018 include, but are not limited to, limiting deductibility of interest and executive compensation expense. These additional items have been considered in our income tax provision for the year ended December 31, 2019 and the impact was not material to the overall financial statements.
The provision (benefit) for income taxes for the years ended December 31, 2019 and 2018 consisted of the following:
| Year Ended | Year Ended | |||||||
| December 31,
2019 | December 31,
2018 | |||||||
| Income Tax Expense (benefit) | ||||||||
| Current federal tax expense | ||||||||
| Federal | $ | 479,000 | $ | -0- | ||||
| State | -0- | -0- | ||||||
| Deferred tax (benefit) | ||||||||
| Federal | $ | (479,000 | ) | $ | -0- | |||
| State | -0- | -0- | ||||||
| Total | $ | -0- | $ | -0- | ||||
F-31
GROWGENERATION CORP. AND SUBSIDIARIES
NOTES TO CONSOLIDATED FINANCIAL STATEMENTS
FOR THE YEARS ENDED DECEMBER 31, 2019 and 2018
| 5. | INCOME TAXES, Continued |
A summary of deferred tax assets and liabilities as of December 31, 2019 and 2018 is as follows:
| Year Ended | Year Ended | |||||||
| December 31, 2019 | December 31, 2018 | |||||||
| Deferred tax assets: | ||||||||
| Net operating losses | 1,033,300 | $ | 2,165,100 | |||||
| Deferred right to use lease liabilities | 1,671,700 | - | ||||||
| Stock based compensation | 354,800 | 663,300 | ||||||
| Amortization of debt discount | - | 346,400 | ||||||
| Accruals, reserves and other | 160,200 | 66,100 | ||||||
| 3,220,000 | 3,240,900 | |||||||
| Deferred tax liabilities: | ||||||||
| Deferred right to use lease assets | 1,678,300 | - | ||||||
| Accumulated depreciation and amortization | $ | 360,000 | $ | 358,000 | ||||
| 2,038,300 | 358,000 | |||||||
| Gross deferred tax asset | 1,181,700 | 2,882,900 | ||||||
| Valuation Allowance | (1,181,700 | ) | (2,882,900 | ) | ||||
| Deferred tax asset (liability), net | $ | 0 | $ | -0 | ||||
As of December 31, 2019, the Company had approximately $4.7 million of operating loss carryforwards, which results in a Federal and State deferred tax asset of approximately $1.03 million, expiring in 2037 through 2038.
We recorded a valuation allowance against all of our deferred tax assets as of both December 31, 2019, and December 31, 2018. We intend to continue maintaining a full valuation allowance on our deferred tax assets until there is sufficient evidence to support the reversal of all or some portion of these allowances. However, given our current earnings and anticipated future earnings, we believe that there is a reasonable possibility that within the next 12 months, sufficient positive evidence may become available to allow us to reach a conclusion that a significant portion of the valuation allowance will no longer be needed. Release of the valuation allowance would result in the recognition of certain deferred tax assets and a decrease to income tax expense for the period the release is recorded. However, the exact timing and amount of the valuation allowance release are subject to change on the basis of the level of profitability that we are able to actually achieve
The differences between the U.S. Federal statutory income tax rate and the Company’s effective tax rate were as follows for the years ended December 31, 2019 and 2018:
| Years Ended December 31, | ||||||||
| 2019 | 2018 | |||||||
| Federal statutory tax rate | 21 | % | 21 | % | ||||
| State and local income taxes (net of federal tax benefit) | - | - | ||||||
| 21 | % | 21 | ||||||
| Valuation allowance | (21 | ) | (21 | ) | ||||
| 0 | % | 0 | % | |||||
F-32
GROWGENERATION CORP. AND SUBSIDIARIES
NOTES TO CONSOLIDATED FINANCIAL STATEMENTS
FOR THE YEARS ENDED DECEMBER 31, 2019 and 2018
| 6. | LONG-TERM DEBT |
| December 31, | ||||||||
| 2019 | 2018 | |||||||
| Long term debt is as follows: | ||||||||
| Hitachi Capital, interest at 8.0% per annum, payable in monthly installments of $631.13 beginning September 2015 through August 2019, secured by delivery equipment with a book value of $24,910 | - | 3,211 | ||||||
| Wells Fargo Equipment Finance, interest at 3.5% per annum, payable in monthly installments of $518.96 beginning April 2016 through March 2021, secured by warehouse equipment with a book value of $25,437 | 7,109 | 12,976 | ||||||
| Notes payable issued in connection with seller financing of assets acquired, interest at 1%, payable in 24 installments of $24,996, due February 2020 | 24,997 | 350,000 | ||||||
| Notes payable issued in connection with seller financing of assets acquired, interest at 1%, payable in 12 installments of $6,003, due September 2019 | - | 54,000 | ||||||
| Notes payable issued in connection with seller financing of assets acquired, interest at 8.125%, payable in 60 installments of $8,440, due August 2023 | 320,204 | 392,252 | ||||||
| $ | 352,310 | $ | 812,439 | |||||
| Less Current Maturities | (110,231 | ) | (436,813 | ) | ||||
| Total Long-Term Debt | $ | 242,079 | $ | 375,626 | ||||
| Debt maturities as of December 31, 2019 are as follows: | ||||
| 2020 | $ | 110,231 | ||
| 2021 | 84,714 | |||
| 2022 | 91,860 | |||
| 2023 | 65,505 | |||
| $ | 352,310 | |||
Interest expense for the years ended December 31, 2019 and 2018 was $45,191 and $23,565, respectively.
| 7. | LEASES |
We determine if a contract contains a lease at inception. Our material operating leases consist of retail and warehouse locations as well as office space. Our leases generally have remaining terms of 1- 5 years, most of which include options to extend the leases for additional 3 to 5 year periods. Generally, the lease term is the minimum of the noncancelable period of the lease or the lease term inclusive of reasonably certain renewal periods.
Operating lease assets and liabilities are recognized at the lease commencement date. Operating lease liabilities represent the present value of lease payments not yet paid. Operating lease assets represent our right to use an underlying asset and are based upon the operating lease liabilities adjusted for prepayments or accrued lease payments, initial direct costs, lease incentives, and impairment of operating lease assets. To determine the present value of lease payments not yet paid, we estimate incremental secured borrowing rates corresponding to the maturities of the leases. Our leases typically contain rent escalations over the lease term. We recognize expense for these leases on a straight-line basis over the lease term.
We elected this expedient to account for lease and non-lease components as a single component for our entire population of operating lease assets.
F-33
GROWGENERATION CORP. AND SUBSIDIARIES
NOTES TO CONSOLIDATED FINANCIAL STATEMENTS
FOR THE YEARS ENDED DECEMBER 31, 2019 and 2018
| 7. | LEASES, Continued |
We have elected the short-term lease recognition exemption for all applicable classes of underlying assets. Short-term disclosures include only those leases with a term greater than one month and 12 months or less, and expense is recognized on a straight-line basis over the lease term. Leases with an initial term of 12 months or less, that do not include an option to purchase the underlying asset that we are reasonably certain to exercise, are not recorded on the balance sheet.
| December 31, | ||||
| 2019 | ||||
| Right to use assets, operating lease assets | $ | 7,628,591 | ||
| Current lease liability | $ | 1,836,700 | ||
| Non-current lease liability | 5,807,266 | |||
| $ | 7,643,966 | |||
| December 31, | ||||
| 2019 | ||||
| Weighted average remaining lease term | 3.9 years | |||
| Weighted average discount rate | 7.6 | % | ||
| Operating lease assets obtained for operating lease liabilities | $ | 3,050,164 | ||
| Maturities of lease liabilities | ||||
| 2020 | $ | 2,496,070 | ||
| 2021 | 2,525,468 | |||
| 2022 | 2,078,123 | |||
| 2023 | 1,596,229, | |||
| 2024 | 813,984 | |||
| 2025 | 654,160 | |||
| 2026 | 352,955 | |||
| 2027 | 152,637 | |||
| Total lease payments | 10,669,626 | |||
| Less: Imputed interest | (3,025,660 | ) | ||
| Lease Liability at December 31, 2019 | $ | 7,643,966 | ||
F-34
GROWGENERATION CORP. AND SUBSIDIARIES
NOTES TO CONSOLIDATED FINANCIAL STATEMENTS
FOR THE YEARS ENDED DECEMBER 31, 2019 and 2018
| 8. | CONVERTIBLE DEBT |
On January 12, 2018, the Company completed a private placement of a total of 36 units of the Company’s securities at the price of $250,000 per unit pursuant to Section 4(a)(2) of the Securities Act of 1933, as amended (the “Securities Act”) and Rule 506 of Regulation D promulgated thereunder. Each unit consisted of (i) a .1% unsecured convertible promissory note of the principal amount of $250,000, and (ii) a 3-year warrant entitling the holder to purchase 37,500 shares of the Company’s common stock, par value $.001 per share, at a price of $.01 per share or through cashless exercise.
The convertible debt has a maturity date of January 12, 2021 and the principal balance and any accrued interest is convertible by the holder at any time into Common Stock of the Company at conversion price of $3.00 a share. Principal due and interest accrued on the notes will automatically convert into shares of Common Stock, at the conversion price, if at any time during the term of the notes, commencing twelve (12) months from the date of issuance, the Common Stock trades minimum daily volume of at least 50,000 shares for twenty (20) consecutive days with a volume weighted average price of at least $4.00 per share.
In relation to this transaction, the Company recorded a debt discount of $4,239,000 related to the fair market value of warrants issued as noted above. The debt discount, which was based on an imputed interest rate, is being amortized on a straight-line basis over the life of the convertible debt.
During the year ended December 31, 2019, convertible debt and accrued interest of $2,405,269, net of unamortized debt discount of $674,581, was converted into 1,258,608 shares of common stock at the conversion rate of $3.00 per share.
During the year ended December 31, 2018, convertible debt and accrued interest of $5,927,677, net of unamortized debt discount of $2,305,746, was converted into 2,013,294 shares of common stock at the conversion rate of $3.00 per share.
| December 31, | ||||||||
| 2019 | 2018 | |||||||
| Convertible debt | $ | - | $ | 3,075,000 | ||||
| Remaining unamortized debt discount and debt issue costs | - | (1,030,887 | ||||||
| Convertible debt, net of debt discount and debt issue costs | $ | - | $ | 2,044,113 | ||||
Amortization of debt discount for the years ended December 31, 2019 and 2018 was $356,306 and $998,601, respectively.
At December 31, 2019 and 2018 there were 131,250 and 536,250 warrants outstanding, respectively, related to the issuance of convertible debt.
| 9. | SHARE BASED PAYMENTS AND STOCK OPTIONS |
On March 6, 2014, the Company’s Board of Directors (the “Board”) approved the 2014 Equity Incentive Plan (“2014 Plan) pursuant to which the Company may grant incentive, non-statutory options, stock appreciation rights, restricted stock, restricted stock units, performance shares, performance units and other stock or cash awards to employees, nonemployee members of our Board, consultants and other independent advisors who provide services to the Company. The maximum shares of common stock which may be issued over the term of the plan shall not exceed 2,500,000 shares. Awards under this plan are made by the Board or a committee designated by the Board. Options under the plan are to be issued at the market price of the stock on the day of the grant except to those issued to holders of 10% or more of the Company’s common stock which is required to be issued at a price not less than 110% of the fair market value on the day of the grant. Each option is exercisable at such time or times, during such period and for such numbers of shares shall be determined by the plan administrator. No option may be exercisable for more than ten years (five years in the case of an incentive stock option granted to a 10% stockholder) from the date of grant.
F-35
GROWGENERATION CORP. AND SUBSIDIARIES
NOTES TO CONSOLIDATED FINANCIAL STATEMENTS
FOR THE YEARS ENDED DECEMBER 31, 2019 and 2018
| 9. | SHARE BASED PAYMENTS AND STOCK OPTIONS, Continued |
On January 7, 2018, the Board adopted the 2018 Equity Compensation Plan (the “2018 Plan”) and on April 20, 2018, the shareholders approved the 2018 Plan. On February 7, 2020, the Board approved the amendment and restatement of the 2018 Plan to increase the number of shares issuable thereunder from 2,500,000 to 5,000,000, which amendment is pending shareholder approval. The 2018 Plan will be administered by the Board. The Board may grant options to purchase shares of Common Stock, stock appreciation rights, restricted stock units, restricted or unrestricted shares of Common Stock, performance shares, performance units, other cash-based awards and other stock-based awards. The Board also has broad authority to determine the terms and conditions of each option or other kind of equity award, adopt, amend and rescind rules and regulations for the administration of the 2018 Plan and amend or modify outstanding options, grants and awards.
No options, stock purchase rights or awards may be made under the 2018 Plan on or after the ten-year anniversary of the adoption of the 2018 Plan by the Board, but the 2018 Plan will continue thereafter while previously granted options, stock appreciation rights or awards remain subject to the 2018 Plan. The maximum shares of Common Stock which may be issued over the term of the plan, as amended shall not exceed 5,000,000 shares. Options granted under the 2018 Plan may be either “incentive stock options” that are intended to meet the requirements of Section 422 of the Internal Revenue Code of 1986, as amended (the “Code”) or “nonstatutory stock options” that do not meet the requirements of Section 422 of the Code. The Board will determine the exercise price of options granted under the 2018 Plan. The exercise price of stock options may not be less than the fair market value, on the date of grant, per share of our Common Stock issuable upon exercise of the option (or 110% of fair market value in the case of incentive options granted to a ten-percent stockholder). No option may be exercisable for more than ten years (five years in the case of an incentive stock option granted to a 10% stockholder) from the date of grant.
| 2019 | ||||
| Awards issued under the 2014 Plan as of December 31, 2019 are summarized below: | ||||
| Total Shares available for issuance pursuant to the 2014 Plan | 2,500,000 | |||
| Options outstanding, December 31 2019 | (995,500 | ) | ||
| Total options exercised under 2014 Plan | (1,118,333 | ) | ||
| Total shares issued pursuant to the 2014 Plan | (375,000 | ) | ||
| Awards available for issuance under the 2014 Plan, December 31, 2019 | 11,167 | |||
Awards issued under the 2018 Plan as of December 31, 2019 are summarized below:
| 2019 | ||||
| Total Shares available for issuance pursuant to the 2018 Plan, prior to amendment | 2,500,000 | |||
| Options outstanding, December 31 2019 | (281,500 | ) | ||
| Total options exercised under 2018 Plan | - | |||
| Total shares issued pursuant to the 2018 Plan | (9,500 | ) | ||
| Awards available for issuance under the 2018 Plan, December 31, 2019 | 2,209,000 | |||
| 2019 | 2018 | |||||||
| Expected volatility | 87.8%-92.7 | % | 72.91%-90.81 | % | ||||
| Expected dividends | None | None | ||||||
| Expected term | 2-5 years | 2.5 years | ||||||
| Risk-free rate | 1.64 | % | 1.64 | % | ||||
F-36
GROWGENERATION CORP. AND SUBSIDIARIES
NOTES TO CONSOLIDATED FINANCIAL STATEMENTS
FOR THE YEARS ENDED DECEMBER 31, 2019 and 2018
| 9. | SHARE BASED PAYMENTS AND STOCK OPTIONS, Continued |
The table below summarizes all the options granted by the Company during years ended December 31, 2019 and 2018:
| Options | Shares | Weighted- Average Exercise Price | Weighted- Average Remaining Contractual Term | Weighted- Average Grant Date Fair Value | ||||||||||
| Outstanding at January 1, 2018 | 2,622,000 | $ | .99 | $ | .32 | |||||||||
| Granted | 386,500 | $ | 3.21 | $ | 1.91 | |||||||||
| Exercised | (1,068,333 | ) | $ | .67 | $ | .12 | ||||||||
| Forfeited or expired | (124,667 | ) | $ | .76 | $ | .16 | ||||||||
| Outstanding at December 31, 2018 | 1,815,500 | $ | 1.66 | 2.65 years | $ | .78 | ||||||||
| Vested and exercisable at December 31 2018 | 1,393,831 | $ | 1.39 | 2.22 years | ||||||||||
| Outstanding at January 1, 2019 | 1,815,500 | $ | 1.66 | 2.65 years | $ | .78 | ||||||||
| Granted | 1,380,000 | $ | 3.25 | $ | 2.18 | |||||||||
| Exercised | (667,500 | ) | $ | .72 | $ | .16 | ||||||||
| Forfeited or expired | (11,667 | ) | $ | 3.05 | $ | 1.63 | ||||||||
| Outstanding at December 31, 2019 | 2,516,333 | $ | 2.78 | 3.81 years | $ | 1.71 | ||||||||
| Vested and exercisable at December 31, 2019 | 1,346,333 | $ | 2.35 | 3.25 years | $ | 1.32 | ||||||||
Share-based payment expense to officers, directors and employees and the years ended December 31, 2019 and 2018 was approximately $2,223,100 and $901,900, respectively.
Expense related to issuance of shares, options and warrants to consultants for the years ended December 31, 2019 and 2018 was approximately $267,400 and $501,800, respectively.
| 10. | STOCK PURCHASE WARRANTS |
A summary of the status of the Company’s outstanding stock warrants as of December 31, 2019 is as follows:
| Weighted Average | ||||||||
| Exercise Price | ||||||||
| Outstanding January 1, 2018 | 3,605,728 | $ | 1.84 | |||||
| Granted/issued | 1,916,500 | $ | 1.01 | |||||
| Exercised | (2,242,728 | ) | $ | 1.16 | ||||
| Forfeited | - | |||||||
| Outstanding December 31, 2018 | 3,279,500 | $ | 1.94 | |||||
| Granted/issued | 2,061,629 | $ | 3.50 | |||||
| Exercised | (1,643,610 | ) | $ | .79 | ||||
| Forfeited | - | |||||||
| Outstanding December 31, 2019 | 3,697,519 | $ | 3.25 | |||||
F-37
GROWGENERATION CORP. AND SUBSIDIARIES
NOTES TO CONSOLIDATED FINANCIAL STATEMENTS
FOR THE YEARS ENDED DECEMBER 31, 2018 and 2017
| 11. | STOCKHOLDERS’ EQUITY |
Common Stock
The Company’s current Certificate of Incorporation authorizes it to issue 100,000,000 shares of common stock, par value $0.001 per share. As of December 31, 2019, and 2018, there were 36,876,305 and 27,948,609 shares of common stock issued and outstanding, respectively.
2019
During the year ended December 31, 2019, the Company sold 4,123,254 shares of common stock for net proceeds of $12,643,634.
During the year ended December 31, 2019, the Company issued 1,757,913 shares of common stock upon exercise of warrants resulting in proceeds to the Company of $1,299,899.
During the year ended December 31, 2019, the Company issued 515,868 shares of common stock upon exercise of 667,500 options resulting in proceeds to the Company of $6,000. Of the total options exercised, 657,500 options we exercised in a cashless option exercise.
During the year ended December 31, 2019, the Company issued 1,258,608 shares of common stock upon conversion of convertible debt and accrued interest. (See Note 7)
During the year ended December 31, 2019, the Company issued 969,553 shares of common stock in connection with business combinations. (See Note 14)
During the year ended December 31, 2019, the Company issued 152,500 shares of common stock to employees valued at $452,766, issued 100,000 shares of common stock to employees for accrued employee awards valued at $210,200 and 50,000 shares of common stock to consultants valued at $96,000.
2018
During the year ended December 31, 2018, the Company sold 3,333,333 shares of common stock for net proceeds of $9,959,877.
During the year ended December 31, 2018, the Company issued 3,076,461 shares of common stock upon exercise of 3,056,478 warrants resulting in proceeds to the Company of $2,593,694.
During the year ended December 31, 2018, the Company issued 995,186 shares of common stock upon exercise of 1,068,333 options resulting in proceeds to the Company of $321,701.
During the year ended December 31, 2018, the Company issued 2,013,294 shares of common stock upon conversion of convertible debt and accrued interest. (See Note 7)
During the year ended December 31, 2018, the Company issued 1,550,000 shares of common stock in connection with business combinations. (See Note 14)
During the year ended December 31, 2018, the Company issued 123,500 shares of common stock to employees valued at $463,922 and issued 10,000 shares of common stock to consultants valued at $45,001.
F-38
GROWGENERATION CORP. AND SUBSIDIARIES
NOTES TO CONSOLIDATED FINANCIAL STATEMENTS
FOR THE YEARS ENDED DECEMBER 31, 2019 and 2018
| 12. | EARNINGS PER SHARE |
Basic net income (loss) per share is computed by dividing net income (loss) attributable to common shareholders by the weighted average number of common shares outstanding. Diluted net income (loss) per share is computed by dividing net income (loss) attributable to common shareholders by the weighted average number of common shares outstanding plus the number of common shares that would be issued assuming exercise or conversion of all potentially dilutive common shares. Potentially dilutive securities are excluded from the calculation when their effect would be antidilutive. For the year ended December 31, 2018 all potentially dilutive securities have been excluded from the diluted share calculations as they were anti-dilutive as a result of the net loss incurred. Accordingly, basic shares equal diluted shares for the year ended December 31, 2018.
Potentially dilutive securities were comprised of the following:
| December 31, 2019 | December 31, 2018 | |||||||
| Warrants | 3,697,519 | 3,279,500 | ||||||
| Convertible debt warrants | 131,250 | 536,250 | ||||||
| Options | 2,516,333 | 1,815,500 | ||||||
| Total | 6,345,102 | 5,631,250 | ||||||
The following table sets forth the composition of the weighted average shares (denominator) used in the basic and dilutive earnings per share computation for the years ended December 31, 2019 and 2018.
| December 31, 2019 | December 31, 2018 | |||||||
| Net income (loss) | $ | 1,878,804 | $ | (5,073,755 | ) | |||
| Weighted average shares outstanding, basic | 32,883,594 | 23,492,650 | ||||||
| Effect of dilutive common stock equivalents | 6,345,102 | - | ||||||
| Adjusted weighted average shares outstanding, dilutive | 39,228,696 | 23,492,650 | ||||||
| Basic net income (loss) per share | $ | .06 | $ | (.22 | ) | |||
| Dilutive net income (loss) per share | $ | .05 | $ | (.22 | ) | |||
| 13. | VENDOR CONCENTRATIONS |
As of December 31, 2019, and 2018, two suppliers represent 51% and 56% of our purchases, respectively. Although the Company expects to maintain relationships with these vendors, the loss of either supplier would not have a material adverse impact on our business, because both suppliers provide the same products.
F-39
GROWGENERATION CORP. AND SUBSIDIARIES
NOTES TO CONSOLIDATED FINANCIAL STATEMENTS
FOR THE YEARS ENDED DECEMBER 31, 2019 and 2018
| 14. | ACQUISITIONS |
The Company accounts for acquisitions in accordance with ASC 805 “Business Combinations.” Assets acquired and liabilities assumed are recorded in the accompanying consolidated balance sheets at their estimated fair values, as of the acquisition date. For all acquisitions, the preliminary allocation of the purchase price was based upon a preliminary valuation, and the Company’s estimates and assumptions are subject to change within the measurement period as valuations are finalized. The Company has not made any adjustments to the preliminary valuations. The table below represents the allocation of the preliminary purchase price to the acquired net assets during the year ended December 31, 2019.
| Grow World LLC | Grand Rapids Hydro | Green Life Garden | Chlorophyll | Reno Hydroponics | Palm Springs Hydroponics | Total | ||||||||||||||||||||||
| Inventory | $ | 553,900 | $ | 1,453,100 | $ | 1,038,600 | $ | 1,441,000 | $ | 238,000 | $ | 465,500 | $ | 5,190,100 | ||||||||||||||
| Prepaids and other current assets | - | 14,100 | 22,000 | - | 36,100 | |||||||||||||||||||||||
| Furniture and equipment | 35,000 | 50,000 | 100,000 | 100,000 | 25,000 | 25,000 | 335,000 | |||||||||||||||||||||
| Goodwill | 696,900 | 2,376,900 | 2,305,900 | 2,596,100 | 516,300 | 554,000 | 9,046,100 | |||||||||||||||||||||
| Total | $ | 1,285,800 | $ | 3,880,000 | $ | 3,458,600 | $ | 4,159,100 | $ | 779,300 | $ | 1,044,500 | $ | 14,607,300 | ||||||||||||||
The table below represents the consideration paid for the net assets acquired in business combinations.
| Grow World LLC | Grand Rapids Hydro | Green Life Garden | Chlorophyll | Reno Hydroponics | Palm Springs Hydroponics | Total | ||||||||||||||||||||||
| Cash | $ | 1,000,000 | $ | 2,350,000 | $ | 2,647,700 | $ | 3,659,100 | $ | 525,000 | $ | 800,000 | $ | 10,981,800 | ||||||||||||||
| Common stock | 285,800 | 1,530,000 | 810,900 | 500,000 | 254,300 | 244,500 | 3,625,500 | |||||||||||||||||||||
| Total | $ | 1,285,800 | $ | 3,880,000 | $ | 3,458,600 | $ | 4,159,100 | $ | 779,300 | $ | 1,044,500 | $ | 14,607,300 | ||||||||||||||
The following table discloses the date of the acquisitions noted above and the revenue and earnings included in the consolidated income statement from the date of acquisition to the period ended December 31, 2019.
| Grow World LLC | Grand Rapids Hydro | Green Life Garden | Chlorophyll | Reno Hydroponics | Palm Springs Hydroponics | Total | ||||||||||||||||||||||
| Acquisition date | 12/16/19 | 9/3/2019 | 5/14/2019 | 1/21/2019 | 2/11/2019 | 2/7/2019 | ||||||||||||||||||||||
| Revenue | $ | 153,900 | $ | 2,412,700 | $ | 4,829,800 | $ | 6,030,500 | $ | 2,106,900 | $ | 3,075,300 | $ | 18,609,100 | ||||||||||||||
| Earnings | $ | 6,400 | $ | 444,500 | $ | 998,700 | $ | 936,600 | $ | 366,742 | $ | 651,400 | $ | 3,404,342 | ||||||||||||||
The following represents the unaudited pro forma consolidated income statement as if the acquisitions had been included in the consolidated results of the Company for the year ended December 31, 2018. These unaudited pro forma results are presented for information purposes only and are not necessarily indicative of what the actual results of operations of the combined company would have been if the acquisition had occurred at the beginning of the earliest period presented, nor are they indicative of future results of operations.
| December 31, 2018 | ||||
| Revenue | $ | 59,650,900 | ||
| Earnings | $ | (2,087,900 | ) | |
F-40
GROWGENERATION CORP. AND SUBSIDIARIES
NOTES TO CONSOLIDATED FINANCIAL STATEMENTS
FOR THE YEARS ENDED DECEMBER 31, 2019 and 2018
| 15. | SUBSEQUENT EVENTS |
On February 26, 2020 the Company purchased the assets of Healthy Harvest LLC for $1,750,000 and 250,000 shares of the Company’s common stock valued at $1,102,500. Healthy Harvest has been in business since 2011 and is the largest hydroponic operation in the Southeast region.
On February 7, 2020, the Board approved the amendment and restatement of the 2018 Plan to increase the number of shares issuable thereunder from 2,500,000 to 5,000,000, which amendment is pending shareholder approval.
F-41
$35,000,000
Common Stock
PRELIMINARY PROSPECTUS
Sole Book-Running Manager
Oppenheimer & Co.
Co-Managers
| Ladenburg Thalmann | Lake Street |
, 2020
PART II – INFORMATION NOT REQUIRED IN PROSPECTUS
Item 13. Other Expenses of Issuance and Distribution
The following table sets forth the expenses in connection with this registration statement. All of such expenses are estimates, other than the filing fees payable to the Securities and Exchange Commission.
|
Amount to be paid |
||||
| SEC registration fee | $ | 5,224.45 | ||
| FINRA filing fees | $ | * | ||
| Transfer agent and registrar fees | $ | * | ||
| Accounting fees and expenses | $ | * | ||
| Legal fees and expenses | $ | * | ||
| Blue sky qualification fees and expenses | $ | * | ||
| Printing expenses | $ | * | ||
| Miscellaneous expenses | $ | * | ||
| Total | $ | * | ||
* To be completed by amendment.
Item 14. Indemnification of Directors and Officers
The Colorado Business Corporation Act (the “CBCA”) generally provides that a corporation may indemnify a person made party to a proceeding because the person is or was a director against liability incurred in the proceeding if: the person’s conduct was in good faith; the person reasonably believed, in the case of conduct in an official capacity with the corporation, that such conduct was in the corporation’s best interests, and, in all other cases, that such conduct was at least not opposed to the corporation’s best interests; and, in the case of any criminal proceeding, the person had no reasonable cause to believe that the person’s conduct was unlawful. The CBCA prohibits such indemnification in a proceeding by or in the right of the corporation in which the person was adjudged liable to the corporation, or in connection with any other proceeding in which the person was adjudged liable for having derived an improper personal benefit. The CBCA further provides that, unless limited by its articles of incorporation, a corporation shall indemnify a person who was wholly successful, on the merits or otherwise, in the defense of any proceeding to which the person was a party because the person is or was a director or officer of the corporation, against reasonable expenses incurred by the person in connection with the proceeding. In addition, a director or officer, who is or was a party to a proceeding, may apply for indemnification to the court conducting the proceeding or to another court of competent jurisdiction. The CBCA allows a corporation to indemnify and advance expenses to an officer, employee, fiduciary or agent of the corporation to the same extent as a director.
As permitted by the CBCA, the Company’s articles of incorporation and bylaws generally provide that the Company shall indemnify its directors and officers to the fullest extent permitted by the CBCA. In addition, the Company may also indemnify and advance expenses to an officer who is not a director to a greater extent, not inconsistent with public policy, and if provided for by its bylaws, general or specific action of the Company’s board of director or shareholders.
The Company has entered into substantively identical indemnification agreements, or agreements containing an indemnification clause, with its current directors and officers (the “Indemnitees”), which generally provide that, to the fullest extent permitted by Colorado law, the Company shall indemnify such Indemnitee if the Indemnitee was or is a party or is threatened to be made a party to any threatened, pending or completed action, suit or proceeding, whether civil, criminal, administrative or investigative, by reason of the fact that the Indemnitee is or was or has agreed to serve at the Company’s request as a director, officer, employee or agent of the Company, or while serving as a director or officer of the Company, is or was serving or has agreed to serve at the Company’s request as a director, officer, employee or agent of another corporation, partnership, joint venture, trust, employee benefit plan or other enterprise, or by reason of any action alleged to have been taken or omitted in such capacity or by reason of the imposition upon such officer or director of any federal and/or state income tax obligation (inclusive of any interest and penalties, if applicable), that is imposed on such officer or director with respect to income, “phantom income,” rescinded or unconsummated transactions, or any other allegedly taxable event for which no benefit was received by such officer or director. The indemnification obligation includes, without limitation, claims for monetary damages against an Indemnitee in respect of an alleged breach of fiduciary duties and generally covers expenses (including attorneys’ fees), judgments, fines and amounts paid in settlement actually and reasonably incurred by an Indemnitee or on an Indemnitee’s behalf in connection with such action, suit or proceeding and any appeal therefrom, but shall only be provided if the Indemnitee acted in good faith; and, in the case of conduct in an official capacity with the corporation, if such conduct was in the Company’s best interests, and, in all other cases, if such conduct was at least not opposed to the Company’s best interests; and, with respect to any criminal action, suit or proceeding, if the Indemnitee had no reasonable cause to believe the Indemnitee’s conduct was unlawful.
II-1
Section 7-108-402(1) of the CBCA permits a corporation to include in its articles of incorporation a provision eliminating or limiting the personal liability of directors to the corporation or its shareholders for monetary damages for any breach of fiduciary duty as a director (except for breach of a director’s duty of loyalty, acts or omissions not in good faith or which involve intentional misconduct or a knowing violation of law, unlawful distributions, or any transaction from which the director derived improper personal benefit). Further, Section 7-108-402(2) of the CBCA provides that no director or officer shall be personal liable for any injury to persons or property arising from a tort committed by an employee, unless the director or officer was either personally involved in the situation giving rise to the litigation or committed a criminal offense in connection with such situation.
As permitted by the CBCA, the Company’s articles of incorporation provide that the personal liability of the Company’s directors to the Company or its shareholders is limited to the fullest extent permitted by the CBCA.
Section 7-109-108 of the CBCA provides that a corporation may purchase and maintain insurance on behalf of a person who is or was a director, officer, employee, fiduciary or agent of the corporation, or who, while a director, officer, employee, fiduciary or agent of the corporation, is or was serving at the request of the corporation as a director, officer, partner, trustee, employee, fiduciary or agent of another entity or an employee benefit plan, against liability asserted against or incurred by the person in that capacity or arising from the person’s status as a director, officer, employee, fiduciary or agent, whether or not the corporation would have power to indemnify the person against the same liability under the CBCA.
As permitted by the CBCA, the Company’s bylaws authorize the Company to purchase and maintain such insurance. The Company currently maintains a directors and officers insurance policy insuring its past, present and future directors and officers, within the limits and subject to the limitations of the policy, against expenses in connection with the defense of actions, suits or proceedings, and certain liabilities that might be imposed as a result of such actions, suits or proceedings.
Item 15. Recent Sales of Unregistered Securities.
2017 Private Placements
On March 10, 2017, the Company closed a private placement of a total of 825,000 units of its securities to 4 accredited investors. Each unit consists of (i) one share of the Company’s common stock and (ii) one 5-year warrant to purchase one share of common stock at an exercise price of $2.75 per share. The Company raised an aggregate of $1,650,000 gross proceeds in the offering.
On May 16, 2017, the Company closed a private placement of a total of 1,000,000 units of its securities to 27 accredited investors through GVC Capital LLC (“GVC Capital”) as its placement agent. Each unit consists of (i) one share of the Company’s common stock and (ii) one 5-year warrant to purchase one share of common stock at an exercise price of $2.75 per share. The Company raised an aggregate of $2,000,000 gross proceeds in the offering. The Company paid GVC Capital total compensation for its services, (i) for a price of $100, 5-year warrants to purchase 75,000 shares at $2.00 per share and 5-year warrants to purchase 75,000 shares at $2.75 per share, (ii) a cash fee of $150,000, (iii) a non-accountable expense allowance of $60,000, and (iv) a warrant exercise fee equal to 3% of all sums received by the Company from the exercise of 750,000 warrants (not including 250,000 warrants issued to one investor) when they are exercised.
2018 Private Placements
On January 17, 2018, the Company completed a private placement of a total of 36 units of its securities at the price of $250,000 per unit. Each unit consists of (i) a .1% unsecured convertible promissory note of the principal amount of $250,000, and (ii) a 3-year warrant entitling the holder to purchase 37,500 shares of common stock, at a price of $.01 per share or through cashless exercise. The Company raised gross proceeds of $9,000,000 from 23 accredited investors in the offering.
On May 9, 2018, the Company completed a private placement of a total of 33.33 units of its securities at a price of $300,000 per unit to 3 accredited investors. Each unit consists of (i) 100,000 share of the Company’s Common Stock and (ii) 50,000 3-year warrant to purchase one share of Common Stock at an exercise price of $.35 per share. The Company raised an aggregate of $10,000,000 gross proceeds in the offering.
2019 Private Placement
On June 26, 2019, the Company completed a private placement of a total of 4,123,254 units of the Company’s securities at the price of $3.10 per unit pursuant to Section 4(a)(2) of the Securities Act and Rule 506 of Regulation D promulgated under the Securities Act. Each unit consisted of (i) one share of Common Stock and (ii) one 3-year warrant, each entitling the holder to purchase one half share of Common Stock, at a price of $3.5 per share. The Company raised a total of $12,782,099 from 19 accredited investors.
II-2
Item 16. Exhibits and Financial Statement Schedules.
II-3
II-4
| * | To be filed by amendment. |
Item 17. Undertakings.
(a) Insofar as indemnification for liabilities arising under the Securities Act may be permitted to directors, officers and controlling persons of the Registrant pursuant to the foregoing provisions, or otherwise, the Registrant has been advised that in the opinion of the Securities and Exchange Commission such indemnification is against public policy as expressed in the Securities Act and is, therefore, unenforceable. In the event that a claim for indemnification against such liabilities (other than the payment by the Registrant of expenses incurred or paid by a director, officer or controlling person of the Registrant in the successful defense of any action, suit or proceeding) is asserted by such director, officer or controlling person in connection with the securities being registered, the Registrant will, unless in the opinion of its counsel the matter has been settled by controlling precedent, submit to a court of appropriate jurisdiction the question whether such indemnification by it is against public policy as expressed in the Securities Act and will be governed by the final adjudication of such issue.
(b) The undersigned Registrant hereby undertakes that:
(1) For purposes of determining any liability under the Securities Act, the information omitted from the form of prospectus filed as part of this registration statement in reliance on Rule 430A and contained in a form of prospectus filed by the Registrant pursuant to Rule 424(b)(1) or (4) or 497(h) under the Securities Act shall be deemed to be a part of this registration statement as of the time it was declared effective.
(2) For purposes of determining any liability under the Securities Act, each post-effective amendment that contains a form of prospectus shall be deemed to be a new registration statement relating to the securities offered therein, and the offering of such securities at that time shall be deemed to be the initial bona fide offering thereof.
II-5
SIGNATURES
Pursuant to the requirements of the Securities Act, the registrant has duly caused this registration statement to be signed on its behalf by the undersigned, thereunto duly authorized, in the city of New York, State of New York on June 9, 2020.
| GROWGENERATION CORP. | ||
| By: | /s/ Darren Lampert | |
| Name: Darren Lampert | ||
| Title: Chief Executive Officer | ||
| By: | /s/ Monty Lamirato | |
| Name: Monty Lamirato | ||
| Title: Chief Financial Officer | ||
KNOW ALL MEN BY THESE PRESENTS, that we, the undersigned officers and directors GrowGeneration Corp., a Colorado corporation (the “Company”), do hereby constitute and appoint Darren Lampert and Monty Lamirato, and each of them, as the true and lawful attorneys-in-fact and agents of the undersigned, with full power of substitution and resubstitution, for and in the name, place and stead of the undersigned, to sign in any and all capacities (including, without limitation, the capacities listed below), the registration statement, any and all amendments (including post-effective amendments) to the registration statement and any and all successor registration statements of the registrant, including any filings pursuant to Rule 462(b) under the Securities Act of 1933, as amended, and to file the same, with all exhibits thereto, and all other documents in connection therewith, with the Securities and Exchange Commission, and hereby grants to such attorneys-in-fact and agents, and each of them, full power and authority to do and perform each and every act and anything necessary to be done to enable the registrant to comply with the provisions of the Securities Act and all the requirements of the Securities and Exchange Commission, as fully to all intents and purposes as the undersigned might or could do in person, hereby ratifying and confirming all that said attorneys-in-fact and agents, or any of them, or their or his or her substitute, or substitutes, may lawfully do or cause to be done by virtue hereof.
Pursuant to the requirements of the Securities Act, this registration statement has been signed below by the following persons in the capacities set forth opposite their names and on the dates indicated.
| Person | Title | Date | ||
| /s/ Darren Lampert | Chief Executive Officer and Director | June 9, 2020 | ||
| Darren Lampert | (Principal Executive Officer) | |||
| /s/ Monty Lamirato | Chief Financial Officer | June 9, 2020 | ||
| Monty Lamirato | (Principal Financial and Accounting Officer) | |||
| /s/ Michael Salaman | President and Director | June 9, 2020 | ||
| Michael Salaman | ||||
| /s/ Stephen Aiello | Director | June 9, 2020 | ||
| Stephen Aiello | ||||
| /s/ Sean Stiefel | Director | June 9, 2020 | ||
| Sean Stiefel | ||||
| /s/ Paul Ciasullo | Director | June 9, 2020 | ||
| Paul Ciasullo |
II-6