0001604868falseFY2022http://fasb.org/us-gaap/2022#GoodwillAndIntangibleAssetImpairmenthttp://fasb.org/us-gaap/2022#GoodwillAndIntangibleAssetImpairmenthttp://fasb.org/us-gaap/2022#GoodwillAndIntangibleAssetImpairment.500016048682022-01-012022-12-3100016048682022-06-30iso4217:USD00016048682023-02-27xbrli:shares00016048682020-01-012020-12-3100016048682021-01-012021-12-3100016048682022-12-3100016048682021-12-31iso4217:USDxbrli:shares0001604868us-gaap:CommonStockMember2019-12-310001604868us-gaap:AdditionalPaidInCapitalMember2019-12-310001604868us-gaap:RetainedEarningsMember2019-12-3100016048682019-12-310001604868us-gaap:CommonStockMember2020-01-012020-12-310001604868us-gaap:AdditionalPaidInCapitalMember2020-01-012020-12-310001604868us-gaap:RetainedEarningsMember2020-01-012020-12-310001604868us-gaap:CommonStockMember2020-12-310001604868us-gaap:AdditionalPaidInCapitalMember2020-12-310001604868us-gaap:RetainedEarningsMember2020-12-3100016048682020-12-310001604868us-gaap:CommonStockMember2021-01-012021-12-310001604868us-gaap:AdditionalPaidInCapitalMember2021-01-012021-12-310001604868us-gaap:RetainedEarningsMember2021-01-012021-12-310001604868us-gaap:CommonStockMember2021-12-310001604868us-gaap:AdditionalPaidInCapitalMember2021-12-310001604868us-gaap:RetainedEarningsMember2021-12-310001604868us-gaap:CommonStockMember2022-01-012022-12-310001604868us-gaap:AdditionalPaidInCapitalMember2022-01-012022-12-310001604868us-gaap:RetainedEarningsMember2022-01-012022-12-310001604868us-gaap:CommonStockMember2022-12-310001604868us-gaap:AdditionalPaidInCapitalMember2022-12-310001604868us-gaap:RetainedEarningsMember2022-12-31grwg:storegrwg:state0001604868srt:RevisionOfPriorPeriodChangeInAccountingPrincipleAdjustmentMember2021-12-310001604868srt:RevisionOfPriorPeriodErrorCorrectionAdjustmentMember2021-12-310001604868srt:RestatementAdjustmentMembergrwg:DistributionAndOtherSegmentMember2021-01-012021-12-310001604868srt:MaximumMember2022-12-31xbrli:pure0001604868srt:MinimumMemberus-gaap:NotesReceivableMember2022-01-012022-12-310001604868us-gaap:NotesReceivableMembersrt:MaximumMember2022-01-012022-12-310001604868srt:MinimumMemberus-gaap:NotesReceivableMember2022-12-310001604868us-gaap:NotesReceivableMembersrt:MaximumMember2022-12-310001604868us-gaap:VehiclesMember2022-01-012022-12-310001604868srt:MinimumMemberus-gaap:BuildingMember2022-01-012022-12-310001604868srt:MaximumMemberus-gaap:BuildingMember2022-01-012022-12-310001604868srt:MinimumMemberus-gaap:FurnitureAndFixturesMember2022-01-012022-12-310001604868srt:MaximumMemberus-gaap:FurnitureAndFixturesMember2022-01-012022-12-310001604868srt:MinimumMemberus-gaap:ComputerEquipmentMember2022-01-012022-12-310001604868us-gaap:ComputerEquipmentMembersrt:MaximumMember2022-01-012022-12-310001604868us-gaap:LeaseholdImprovementsMember2022-01-012022-12-310001604868us-gaap:SoftwareAndSoftwareDevelopmentCostsMember2022-01-012022-12-310001604868us-gaap:FairValueInputsLevel1Member2022-12-310001604868us-gaap:FairValueInputsLevel1Member2021-12-310001604868us-gaap:FairValueInputsLevel2Member2022-12-310001604868us-gaap:FairValueInputsLevel2Member2021-12-310001604868grwg:LiabilityAwardsMember2022-01-012022-12-310001604868grwg:ReceivablesMember2021-12-310001604868grwg:CustomerDepositLiabilityMember2021-12-310001604868grwg:ReceivablesMember2022-12-310001604868grwg:CustomerDepositLiabilityMember2022-12-310001604868grwg:ReceivablesMember2022-01-012022-12-310001604868grwg:CustomerDepositLiabilityMember2022-01-012022-12-310001604868grwg:ReceivablesMember2020-12-310001604868grwg:CustomerDepositLiabilityMember2020-12-310001604868grwg:ReceivablesMember2021-01-012021-12-310001604868grwg:CustomerDepositLiabilityMember2021-01-012021-12-310001604868srt:MinimumMember2022-01-012022-12-310001604868srt:MaximumMember2022-01-012022-12-310001604868us-gaap:TradeAccountsReceivableMember2022-12-310001604868us-gaap:TradeAccountsReceivableMember2021-12-310001604868us-gaap:NotesReceivableMember2022-12-310001604868us-gaap:NotesReceivableMember2021-12-310001604868us-gaap:VehiclesMember2022-12-310001604868us-gaap:VehiclesMember2021-12-310001604868us-gaap:BuildingMember2022-12-310001604868us-gaap:BuildingMember2021-12-310001604868us-gaap:LeaseholdImprovementsMember2022-12-310001604868us-gaap:LeaseholdImprovementsMember2021-12-310001604868us-gaap:FurnitureAndFixturesMember2022-12-310001604868us-gaap:FurnitureAndFixturesMember2021-12-310001604868grwg:CapitalizedSoftwareMember2022-12-310001604868grwg:CapitalizedSoftwareMember2021-12-310001604868us-gaap:ConstructionInProgressMember2022-12-310001604868us-gaap:ConstructionInProgressMember2021-12-31grwg:reportingUnit0001604868grwg:RetailSegmentMember2020-12-310001604868grwg:EcommerceSegmentMember2020-12-310001604868grwg:DistributionAndOtherSegmentMember2020-12-310001604868grwg:RetailSegmentMember2021-01-012021-12-310001604868grwg:EcommerceSegmentMember2021-01-012021-12-310001604868grwg:DistributionAndOtherSegmentMember2021-01-012021-12-310001604868grwg:RetailSegmentMember2021-12-310001604868grwg:EcommerceSegmentMember2021-12-310001604868grwg:DistributionAndOtherSegmentMember2021-12-310001604868grwg:RetailSegmentMember2022-01-012022-12-310001604868grwg:EcommerceSegmentMember2022-01-012022-12-310001604868grwg:DistributionAndOtherSegmentMember2022-01-012022-12-310001604868grwg:RetailSegmentMember2022-12-310001604868grwg:EcommerceSegmentMember2022-12-310001604868grwg:DistributionAndOtherSegmentMember2022-12-310001604868us-gaap:TradeNamesMember2022-01-012022-12-310001604868us-gaap:PatentsMember2022-01-012022-12-310001604868us-gaap:CustomerRelationshipsMember2022-01-012022-12-310001604868grwg:NonCompetesMember2022-01-012022-12-310001604868us-gaap:IntellectualPropertyMember2022-01-012022-12-310001604868us-gaap:TradeNamesMember2022-12-310001604868us-gaap:TradeNamesMember2021-12-310001604868us-gaap:PatentsMember2022-12-310001604868us-gaap:PatentsMember2021-12-310001604868us-gaap:CustomerRelationshipsMember2022-12-310001604868us-gaap:CustomerRelationshipsMember2021-12-310001604868grwg:NonCompetesMember2022-12-310001604868grwg:NonCompetesMember2021-12-310001604868us-gaap:IntellectualPropertyMember2022-12-310001604868us-gaap:IntellectualPropertyMember2021-12-310001604868srt:MinimumMember2022-12-310001604868grwg:ThousandFourteenPlanMember2014-03-060001604868grwg:ThousandFourteenPlanMember2022-01-012022-12-310001604868us-gaap:EmployeeStockOptionMembergrwg:ThousandFourteenPlanMember2022-01-012022-12-310001604868grwg:ThousandFourteenPlanMembergrwg:IncentiveStockOptionMember2022-01-012022-12-3100016048682020-02-0600016048682020-02-070001604868grwg:ThousandEighteenPlanMember2022-01-012022-12-310001604868grwg:ThousandEighteenPlanMemberus-gaap:EmployeeStockOptionMember2022-01-012022-12-310001604868grwg:ThousandEighteenPlanMembergrwg:IncentiveStockOptionMember2022-01-012022-12-310001604868us-gaap:RestrictedStockMember2022-01-012022-12-310001604868us-gaap:RestrictedStockMember2020-12-310001604868us-gaap:RestrictedStockMember2021-01-012021-12-310001604868us-gaap:RestrictedStockMember2021-12-310001604868us-gaap:RestrictedStockMember2022-12-310001604868grwg:ThousandFourteenPlanMember2022-12-310001604868grwg:ThousandEighteenPlanMember2022-12-310001604868srt:MinimumMember2020-01-012020-12-310001604868srt:MaximumMember2020-01-012020-12-310001604868grwg:LiabilityAwardsMember2022-12-310001604868us-gaap:WarrantMember2020-12-310001604868us-gaap:WarrantMember2021-01-012021-12-310001604868us-gaap:WarrantMember2021-12-310001604868us-gaap:WarrantMember2022-01-012022-12-310001604868us-gaap:WarrantMember2022-12-310001604868us-gaap:WarrantMember2022-11-172022-11-1700016048682022-11-172022-11-170001604868us-gaap:RestrictedStockMember2022-01-012022-12-310001604868us-gaap:RestrictedStockMember2021-01-012021-12-310001604868us-gaap:RestrictedStockMember2020-01-012020-12-310001604868grwg:ShareBasedPaymentArrangementOptionAndWarrantMember2022-01-012022-12-310001604868grwg:ShareBasedPaymentArrangementOptionAndWarrantMember2021-01-012021-12-310001604868grwg:ShareBasedPaymentArrangementOptionAndWarrantMember2020-01-012020-12-310001604868us-gaap:CostOfGoodsTotalMembergrwg:OneSupplierMemberus-gaap:SupplierConcentrationRiskMember2022-01-012022-12-310001604868us-gaap:CostOfGoodsTotalMembergrwg:TwoSuppliersMemberus-gaap:SupplierConcentrationRiskMember2021-01-012021-12-310001604868us-gaap:CostOfGoodsTotalMembergrwg:TwoSuppliersMemberus-gaap:SupplierConcentrationRiskMember2020-01-012020-12-310001604868grwg:ThreeCustomersMemberus-gaap:CustomerConcentrationRiskMemberus-gaap:AccountsReceivableMember2022-01-012022-12-310001604868grwg:HorticulturalRepGroupMember2022-02-012022-02-010001604868grwg:HorticulturalRepGroupMember2022-02-010001604868grwg:StLouisHydroponicCompanyMember2022-11-032022-11-030001604868grwg:StLouisHydroponicCompanyMember2022-11-030001604868grwg:HorticulturalRepGroupMember2022-12-310001604868grwg:StLouisHydroponicCompanyMember2022-12-310001604868grwg:HorticulturalRepGroupMember2022-01-012022-12-310001604868grwg:StLouisHydroponicCompanyMember2022-01-012022-12-310001604868grwg:HealthAndHarvestLLCMember2022-01-012022-12-310001604868grwg:A2022AcquisitionsMember2022-01-012022-12-310001604868grwg:A2022AcquisitionsMember2021-01-012021-12-310001604868grwg:A2022AcquisitionsMember2020-01-012020-12-310001604868grwg:IndoorGardenLightingIncMember2021-01-250001604868grwg:IndoorGardenLightingIncMember2021-01-252021-01-250001604868grwg:GrowDepotMaineMember2021-02-010001604868grwg:GrowDepotMaineMember2021-02-012021-02-010001604868grwg:GrowWarehouseLLCMember2021-02-150001604868stpr:COgrwg:GrowWarehouseLLCMember2021-02-150001604868stpr:OKgrwg:GrowWarehouseLLCMember2021-02-150001604868grwg:GrowWarehouseLLCMember2021-02-152021-02-150001604868grwg:SanDiegoHydroponicsAndOrganicsMember2021-02-220001604868grwg:SanDiegoHydroponicsAndOrganicsMember2021-02-222021-02-220001604868grwg:CharcoirCorporationMember2021-03-122021-03-120001604868grwg:CharcoirCorporationMember2021-03-120001604868grwg:FiftyFiveHydroponicsMember2021-03-152021-03-150001604868grwg:FiftyFiveHydroponicsMember2021-03-150001604868grwg:AquariusMember2021-03-152021-03-150001604868grwg:AquariusMember2021-03-150001604868grwg:AgronMember2021-03-192021-03-190001604868grwg:AgronMember2021-03-190001604868grwg:GrowDepotLLCMember2021-04-192021-04-190001604868grwg:GrowDepotLLCMember2021-04-190001604868grwg:HarvestCompanyMember2021-05-242021-05-240001604868grwg:HarvestCompanyMember2021-05-240001604868grwg:AquaSereneMember2021-07-192021-07-190001604868grwg:AquaSereneMember2021-07-190001604868grwg:MendocinoGreenhouseGardenSupplyMember2021-07-032021-07-030001604868grwg:MendocinoGreenhouseGardenSupplyMember2021-07-030001604868grwg:CommercialGrowSupplyIncMember2021-08-242021-08-240001604868grwg:CommercialGrowSupplyIncMember2021-08-240001604868grwg:HoagtechHydroponicsIncMember2021-08-232021-08-230001604868grwg:HoagtechHydroponicsIncMember2021-08-230001604868grwg:IndoorStoreLLCMember2021-10-152021-10-150001604868grwg:IndoorStoreLLCMember2021-10-150001604868grwg:MobileMediaIncAndMMIAgricultureMember2021-12-312021-12-310001604868grwg:MobileMediaIncAndMMIAgricultureMember2021-12-310001604868grwg:AgronMember2021-12-310001604868grwg:AquariusMember2021-12-310001604868grwg:FiftyFiveHydroponicsMember2021-12-310001604868grwg:CharcoirCorporationMember2021-12-310001604868grwg:SanDiegoHydroponicsAndOrganicsMember2021-12-310001604868grwg:GrowWarehouseLLCMember2021-12-310001604868grwg:GrowDepotMaineMember2021-12-310001604868grwg:IndoorGardenLightingIncMember2021-12-310001604868grwg:DownriverMember2021-12-310001604868grwg:HarvestCompanyMember2021-12-310001604868grwg:AquaSereneMember2021-12-310001604868grwg:MendocinoGreenhouseGardenSupplyMember2021-12-310001604868grwg:CommercialGrowSupplyIncMember2021-12-310001604868grwg:HoagtechHydroponicsIncMember2021-12-310001604868grwg:AllSeasonsMember2021-12-310001604868grwg:AgronMember2021-01-012021-12-310001604868grwg:AquariusMember2021-01-012021-12-310001604868grwg:FiftyFiveHydroponicsMember2021-01-012021-12-310001604868grwg:CharcoirCorporationMember2021-01-012021-12-310001604868grwg:SanDiegoHydroponicsAndOrganicsMember2021-01-012021-12-310001604868grwg:GrowWarehouseLLCMember2021-01-012021-12-310001604868grwg:GrowDepotMaineMember2021-01-012021-12-310001604868grwg:IndoorGardenLightingIncMember2021-01-012021-12-310001604868grwg:DownriverMember2021-01-012021-12-310001604868grwg:HarvestCompanyMember2021-01-012021-12-310001604868grwg:AquaSereneMember2021-01-012021-12-310001604868grwg:MendocinoGreenhouseGardenSupplyMember2021-01-012021-12-310001604868grwg:CommercialGrowSupplyIncMember2021-01-012021-12-310001604868grwg:HoagtechHydroponicsIncMember2021-01-012021-12-310001604868grwg:AllSeasonsMember2021-01-012021-12-310001604868grwg:MobileMediaIncAndMMIAgricultureMember2021-01-012021-12-310001604868grwg:A2021AcquisitionsMember2022-01-012022-12-310001604868grwg:A2021AcquisitionsMember2021-01-012021-12-310001604868grwg:HealthAndHarvestLLCMember2020-02-262020-02-260001604868grwg:H2OHydroponicsLLCMember2020-06-162020-06-160001604868grwg:EmeraldCityMember2020-08-102020-08-100001604868grwg:HydroponicsDepotLLCMember2020-10-122020-10-120001604868grwg:BigGreenTomatoMember2020-10-200001604868grwg:BigGreenTomatoMember2020-10-202020-10-200001604868grwg:GrowBizMember2020-11-170001604868grwg:GrowBizMemberstpr:CA2020-11-170001604868stpr:ORgrwg:GrowBizMember2020-11-170001604868grwg:GrowBizMember2020-11-172020-11-170001604868grwg:GrassrootsMember2020-12-140001604868grwg:GrassrootsMember2020-12-142020-12-140001604868grwg:CanopyMember2020-12-232020-12-230001604868grwg:CanopyMember2020-12-230001604868grwg:CanopyMember2020-12-310001604868grwg:GrassrootsMember2020-12-310001604868grwg:GrowBizMember2020-12-310001604868grwg:BGTMember2020-12-310001604868grwg:HydroDepotMember2020-12-310001604868grwg:EmeraldCityMember2020-12-310001604868grwg:H2OHydroponicsLLCMember2020-12-310001604868grwg:HealthAndHarvestLLCMember2020-12-310001604868grwg:CanopyMember2020-01-012020-12-310001604868grwg:GrassrootsMember2020-01-012020-12-310001604868grwg:GrowBizMember2020-01-012020-12-310001604868grwg:BGTMember2020-01-012020-12-310001604868grwg:HydroDepotMember2020-01-012020-12-310001604868grwg:EmeraldCityMember2020-01-012020-12-310001604868grwg:H2OHydroponicsLLCMember2020-01-012020-12-310001604868grwg:HealthAndHarvestLLCMember2020-01-012020-12-310001604868grwg:A2020AcquisitionsMember2020-01-012020-12-310001604868grwg:PublicStockOfferingMember2020-12-112020-12-110001604868us-gaap:OverAllotmentOptionMember2020-12-112020-12-110001604868grwg:PublicStockOfferingMember2020-12-110001604868grwg:PublicStockOfferingMember2020-07-022020-07-020001604868us-gaap:OverAllotmentOptionMember2020-07-022020-07-020001604868grwg:PublicStockOfferingMember2020-07-020001604868us-gaap:PrivatePlacementMember2019-06-260001604868us-gaap:ImmediateFamilyMemberOfManagementOrPrincipalOwnerMember2022-01-012022-12-31grwg:segment00016048682022-03-312022-03-31grwg:location0001604868grwg:RetailSegmentMembergrwg:PrivateLabelMember2022-01-012022-12-310001604868grwg:RetailSegmentMembergrwg:PrivateLabelMember2021-01-012021-12-310001604868grwg:RetailSegmentMembergrwg:PrivateLabelMember2020-01-012020-12-310001604868grwg:RetailSegmentMembergrwg:NonPrivateLabelMember2022-01-012022-12-310001604868grwg:RetailSegmentMembergrwg:NonPrivateLabelMember2021-01-012021-12-310001604868grwg:RetailSegmentMembergrwg:NonPrivateLabelMember2020-01-012020-12-310001604868grwg:RetailSegmentMember2020-01-012020-12-310001604868grwg:PrivateLabelMembergrwg:EcommerceSegmentMember2022-01-012022-12-310001604868grwg:PrivateLabelMembergrwg:EcommerceSegmentMember2021-01-012021-12-310001604868grwg:PrivateLabelMembergrwg:EcommerceSegmentMember2020-01-012020-12-310001604868grwg:NonPrivateLabelMembergrwg:EcommerceSegmentMember2022-01-012022-12-310001604868grwg:NonPrivateLabelMembergrwg:EcommerceSegmentMember2021-01-012021-12-310001604868grwg:NonPrivateLabelMembergrwg:EcommerceSegmentMember2020-01-012020-12-310001604868grwg:EcommerceSegmentMember2020-01-012020-12-310001604868grwg:PrivateLabelMembergrwg:DistributionAndOtherSegmentMember2022-01-012022-12-310001604868grwg:PrivateLabelMembergrwg:DistributionAndOtherSegmentMember2021-01-012021-12-310001604868grwg:PrivateLabelMembergrwg:DistributionAndOtherSegmentMember2020-01-012020-12-310001604868grwg:NonPrivateLabelMembergrwg:DistributionAndOtherSegmentMember2022-01-012022-12-310001604868grwg:NonPrivateLabelMembergrwg:DistributionAndOtherSegmentMember2021-01-012021-12-310001604868grwg:NonPrivateLabelMembergrwg:DistributionAndOtherSegmentMember2020-01-012020-12-310001604868grwg:CommercialFixtureMembergrwg:DistributionAndOtherSegmentMember2022-01-012022-12-310001604868grwg:CommercialFixtureMembergrwg:DistributionAndOtherSegmentMember2021-01-012021-12-310001604868grwg:CommercialFixtureMembergrwg:DistributionAndOtherSegmentMember2020-01-012020-12-310001604868grwg:DistributionAndOtherSegmentMember2020-01-012020-12-310001604868grwg:GrowGenerationCorpVsTGCSystemsLLCMemberus-gaap:PendingLitigationMember2021-12-310001604868grwg:GrowGenerationCorpVsTGCSystemsLLCMemberus-gaap:PendingLitigationMember2022-12-31
UNITED STATES
SECURITIES AND EXCHANGE COMMISSION
Washington, D.C. 20549
FORM 10-K
x ANNUAL REPORT UNDER SECTION 13 OR 15(d) OF THE SECURITIES EXCHANGE ACT OF 1934
For the Fiscal year ended December 31, 2022
OR
¨ TRANSITION REPORT UNDER SECTION 13 OR 15(d) OF THE SECURITIES EXCHANGE ACT OF 1934
For the transition period from _________ to __________
Commission File Number 333-207889
GROWGENERATION CORP.
(Exact name of registrant as specified in its charter)
| | | | | | | | |
| Colorado | | 46-5008129 |
(State or Other Jurisdiction of
Incorporation or Organization) | | (I.R.S. Employer
Identification No.) |
| | |
5619 DTC Parkway, Suite 900 Greenwood Village, Colorado | | 80111 |
| (Address of Principal Executive Offices) | | (Zip Code) |
(800) 935-8420
(Registrant’s telephone number, including area code)
Securities registered pursuant to Section 12(b) of the Act:
| | | | | | | | | | | | | | |
| Title of each class | | Trading symbol | | Name of each exchange on which registered |
| Common Stock, par value $0.001 per share | | GRWG | | The NASDAQ Stock Market LLC |
Securities registered pursuant to Section 12(g) of the Act:
Title of class
Not Applicable
Not Applicable
(Former name, former address and former fiscal year, if changed since last report)
Indicate by check mark if the registrant is a well-known seasoned issuer, as defined in Rule 405 of the Securities Act. Yes ¨ No x
Indicate by check mark if the registrant is not required to file reports pursuant to Section 13 or Section 15(d) of the Act. Yes ¨ No x
Indicate by check mark whether the registrant (1) filed all reports required to be filed by Section 13 or 15(d) of the Exchange Act during the past 12 months (or for such shorter period that the registrant was required to file such reports), and (2) has been subject to such filing requirements for the past 90 days. Yes x No ¨
Indicate by check mark whether the registrant has submitted electronically Interactive Data File required to be submitted pursuant to Rule 405 of Regulation S-T (§232.405 of this chapter) during the preceding 12 months (or for such shorter period that the registrant was required to submit such files). Yes x No ¨
Indicate by check mark whether the Registrant is a large accelerated filer, an accelerated filer, a non-accelerated filer, a smaller reporting company, or an emerging growth company. See the definitions of “large accelerated filer,” “accelerated filer,” “smaller reporting company,” and “emerging growth company” in Rule 12b-2 of the Exchange Act.
| | | | | | | | | | | |
| Large accelerated filer | ¨ | Accelerated filer | x |
| Non-accelerated filer | ¨ | Smaller reporting company | ¨ |
| | Emerging Growth Company | ¨ |
If an emerging growth company, indicate by check mark if the registrant has elected not to use the extended transition period for complying with any new or revised financial accounting standards provided pursuant to Section 13(a) of the Exchange Act. ¨
Indicate by check mark whether the registrant has filed a report on and attestation to its management’s assessment of the effectiveness of its internal control over financial reporting under Section 404(b) of the Sarbanes-Oxley Act (15 U.S.C. 7262(b)) by the registered public accounting firm that prepared or issued its audit report. Yes x No ¨
If securities are registered pursuant to Section 12(b) of the Act, indicate by check mark whether the financial statements of the registrant included in the filing reflect the correction of an error to previously issued financial statements. ¨
Indicate by check mark whether any of those error corrections are restatements that required a recovery analysis of incentive-based compensation received by any of the registrant’s executive officers during the relevant recovery period pursuant to §240.10D-1(b). ¨
Indicate by check mark whether the registrant is a shell company (as defined in Rule 12b-2 of the Exchange Act). Yes ¨ No x
State the aggregate market value of the voting and non-voting common equity held by non-affiliates computed by reference to the price at which the common equity was last sold, or the average bid and asked price of such common equity, as of June 30, 2022: $206,685,569.
As of February 27, 2023, the Company had 60,993,607 shares of its common stock issued and outstanding, par value $0.001 per share.
Document Incorporated by Reference
Portions of a definitive proxy relating to the registrant’s 2023 Annual Meeting of Shareholders, which will be filed with the Securities and Exchange Commission within 120 days after the close of the fiscal year covered by this Form 10-K, are incorporated into Part III of this Form 10-K.
TABLE OF CONTENTS
PART I
Forward-Looking Information
This Annual Report of GrowGeneration Corp. on Form 10-K contains forward-looking statements, particularly those identified with the words, “anticipates,” “believes,” “expects,” “plans,” “intends,” “objectives,” and similar expressions. These statements reflect management’s best judgment based on factors known at the time of such statements. The reader may find discussions containing such forward-looking statements in the material set forth under “Management’s Discussion and Analysis and Plan of Operations,” generally, and specifically therein under the captions “Liquidity and Capital Resources” as well as elsewhere in this Annual Report on Form 10-K. Actual events or results may differ materially from those discussed herein. The forward-looking statements specified in the following information have been compiled by our management on the basis of assumptions made by management and considered by management to be reasonable. Our future operating results, however, are impossible to predict and no representation, guaranty, or warranty is to be inferred from those forward-looking statements. The assumptions used for purposes of the forward-looking statements specified in the following information represent estimates of future events and are subject to uncertainty as to possible changes in economic, legislative, industry, and other circumstances. As a result, the identification and interpretation of data and other information and their use in developing and selecting assumptions from and among reasonable alternatives require the exercise of judgment. To the extent that the assumed events do not occur, the outcome may vary substantially from anticipated or projected results, and, accordingly, no opinion is expressed on the achievability of those forward-looking statements. No assurance can be given that any of the assumptions relating to the forward-looking statements specified in the following information are accurate, and we assume no obligation to update any such forward-looking statements. There may be additional risks, uncertainties and other factors that we do not currently view as material or that are not necessarily known.
Unless the context otherwise requires, the terms the “Company”, “we”, “our”, “ours” “us” and “GrowGeneration” refer to GrowGeneration Corp. and its subsidiaries, including GrowGeneration USA, Inc. (as successor in interest to GrowGeneration Pueblo Corp., GrowGeneration California Corp., Grow Generation Nevada Corp., GrowGeneration Washington Corp., GrowGeneration Rhode Island Corp., GrowGeneration Michigan Corp., GrowGeneration Oklahoma Corp., GrowGeneration New England Corp., GrowGeneration Florida Corp., Charcoir, Inc., HRG Distribution Corp., GrowGeneration HG Corp., GrowGeneration Hemp Corp., and GrowGeneration Management Corp.), GrowGeneration Canada Corp., GrowGeneration Proprietary Brands, Inc., and GGen Distribution Corp., on a combined basis.
We may announce material business and financial information to our investors using our investor relations website (https://ir.growgeneration.com/). We therefore encourage investors and others interested in GrowGeneration to review the information that we make available on our website, in addition to following our filings with the Securities and Exchange Commission ("SEC"), webcasts, press releases, and conference calls.
ITEM 1. BUSINESS
BACKGROUND
GrowGeneration Corp. (together with all of its direct and indirect wholly owned subsidiaries, collectively “GrowGeneration” or the “Company”), incorporated in Colorado in 2014, is the largest chain of specialty retail hydroponic and organic garden centers in the U.S. and is a leading marketer and distributor of nutrients, growing media, lighting, benching and racking, environmental control systems and other products for both indoor and outdoor hydroponic and organic gardening. Currently, GrowGeneration has 60 retail locations across 16 states in the U.S. We also operate an online superstore for cultivators at growgeneration.com, as well as a wholesale business for resellers, HRG Distribution and MMI.
Our business is driven by a wide selection of products, facility design services, solutions driven staff and pick, pack and ship distribution and fulfillment capabilities. GrowGeneration carries and sells thousands of products, including nutrients, growing media, lighting, environmental control systems, vertical benching and accessories for hydroponic gardening, as well as other indoor and outdoor growing products, that are capable of growing and maximizing yield and quality of a wide range of plants. Our products include proprietary brands such as Charcoir, Drip Hydro, Power Si, MMI benching and racking, Ion lights, Durabreeze fans, and more. GrowGeneration also provides facility design services to commercial growers. We currently employ approximately 455 employees, a majority of them we have branded as “Grow Pros”. Currently, our operations span over 946,000 square feet of retail and warehouse space.
MARKETS
Hydroponics is a specialized method of growing plants using mineral nutrient solutions in a water solvent, as opposed to soil. This method is typically used for indoor cultivation to allow growers to better regulate and control growing
conditions, including nutrient delivery, light, air, water, humidity, pests, and temperature. Hydroponic growers benefit from these techniques by producing crops faster and with higher crop yields as compared to traditional soil-based growers. Indoor growing techniques and hydroponic products are being utilized in new and emerging industries or segments, including the growing of cannabis and hemp. Vertical farms producing organic fruits and vegetables also utilize hydroponics due to a rising shortage of farmland as well as environmental vulnerabilities, including severe weather conditions and pests.
Our target customer segments include the commercial growers in the plant-based medicine market, the craft grower and vertical and urban farmers who grow organic herbs, fruits and vegetables. Additionally, we sell products from our distribution and other segment to wholesalers, resellers, and retailers. Unlike the traditional agricultural industry, these cultivators use innovative indoor and outdoor growing techniques to produce specialty crops in highly controlled environments. This enables them to produce crops at higher yields and quality, regardless of the season or weather conditions.
Controlled-environment agriculture (CEA) is a technology-based approach to maintain optimal growing conditions throughout the development of a crop. Production takes place within an enclosed growing structure such as a greenhouse or building. Plants are often grown using hydroponic methods in order to supply the proper amounts of water and nutrients to the root zone. CEA optimizes the use of resources such as water, energy, space, capital and labor. Different techniques are available for growing in CEA, including vertical farming, which can produce crops all year round in a controlled environment with increased yield and quality by adjusting the amount of light and nutrients the plants receive.
The landscape for hydroponic retail stores is very fragmented, with numerous single stores that we consider “targets” for our acquisition strategy. Further, the products we sell and the expert knowledge we provide are in demand due to the ever-increasing legalization of plant-based medicines, primarily cannabis and hemp, and the increasing number of licensed cultivation facilities.
SEGMENTS
We operate our business through the following business segments:
Retail: The core of our business strategy is to operate the largest chain of retail garden centers in the U.S. The hydroponic retail landscape is fragmented, which allows us to acquire “best of breed” hydroponic retail operations and leverage efficiencies of a centralized organization. During 2022, the Company acquired or opened 5 new locations and expanded its physical retail presence into 4 new states. Our plan is to continue to acquire, open and operate garden centers and related businesses throughout the U.S. However, in light of persistent difficult market conditions, the Company also closed 8 underperforming retail locations in 2022 and may consider additional store consolidation in 2023. Some of our garden centers have multi-functions, with added capabilities that include warehousing, distribution and fulfillment for our online platforms and direct fulfillment to our commercial customers.
Our retail segment also includes our commercial sales organization, which is focused on selling products and services, including end-to-end solutions, for large commercial cultivators outside of the physical retail network. When commercial customers gain new cultivation licenses, they need lighting, benching, environmental control systems, irrigation, fertigation and other products to outfit their facilities. Existing facilities also need consumable products for operations, as well as equipment updates from time to time. Commercial customers typically purchase large dollar amounts and sizes of products. We offer commercial customers volume pricing, terms and financing.
E-commerce: Our digital strategy is primarily focused on capturing the home, craft and commercial grower online. GrowGeneration.com offers thousands of hydroponic products, all curated by our product team. GrowGeneration.com offers customers the option to have their orders shipped directly to their locations, anywhere in North America. GrowGeneration also sells its products to consumers through online marketplaces such as Amazon and Walmart and to wholesalers through its distribution website, HRGdist.com.
Distribution and other: In December 2020, GrowGeneration purchased the business of Canopy Crop Management Corp., the developer of the popular PowerSi line of monosilicic acid products, a widely used nutrient additive for plants. In March 2021, the Company purchased Charcoir, a line of premium coco pots, cubes and medium. In December 2021, the Company purchased the assets of Mobile Media, Inc. ("MMI"), a mobile shelving and storage solutions developer and manufacturer. In February 2022, the Company purchased the assets of Horticultural Rep Group, Inc. ("HRG"), a specialty marketing and sales organization of horticultural products. The Company is in the process of combining the operations and management of these non-retail enterprises. The products these companies provide are integrated into our retail, e-commerce, and direct sales activities and we receive incremental revenue from the sale of these products.
PROPRIETARY BRANDS
As part of its one-stop solution, GrowGeneration provides its customers with a wide selection of top quality products across all categories. A key part of that selection of products is GrowGeneration's own portfolio of industry-leading proprietary brands, including Ion Lighting, PowerSi monosilicic acid, Charcoir coco pots, cubes and medium, Drip Hydro liquid and powder nutrients, MMI Agriculture benching and racking, and other products. We believe that building private label and proprietary brand offerings will not only drive positive experiences and outcomes for customers, but also will have a positive impact on our margins and profitability. As a company of growers ourselves, we understand the ever-changing needs and technologies within our industry and seek to acquire and develop a strong portfolio of proprietary products for our customers.
SOCIAL ENGAGEMENT
GrowGeneration seeks to support its customers and their communities in various ways. Together with Harvest 360 Technologies, LLC (H360), GrowGeneration launched a new program to support education and training for social equity license applicants. Regulations in both New York and New Jersey seek to create a framework to regulate cannabis in these states in a manner that promotes social equity and economic development, placing an emphasis on promoting inclusion of diverse populations in the medicinal and recreational cannabis industries.
As part of this program, GrowGeneration and H360 established the NEXTGEN Micro Cultivation competition for applicants seeking micro grow licenses in the New Jersey adult-use cannabis market. GrowGeneration has agreed to donate up to $500,000 for education and training scholarships for 25 cultivation teams to receive access to an online portal with valuable resources to assist in the preparation of an application and to be educated and informed about best practices in the New Jersey program. GrowGeneration also provides access to equipment packages, facility design services, financing, advanced training and other market resources.
GrowGeneration also supports communities through charitable donations to various causes, both within and outside the hydroponics industry.
HOW WE EVALUATE OUR OPERATIONS
Sales
The Company generates sales primarily from the sale of hydroponic garden products, including nutrients, growing media, lighting, environmental control systems, and accessories for hydroponic gardening, as well as other indoor and outdoor growing products. In addition to these product sales, the Company sells and installs commercial fixtures.
The Company allocates transaction price to each distinct performance obligation and recognizes revenue, net of estimated returns and sales tax, at the time when it transfers control of the product to customers or when services are completed. Revenues are measured based on the amount of consideration that the Company expects to receive as derived from a list price, reduced by estimates for variable consideration. The variable consideration is based on the estimate of expected sales returns. The majority of our returns come from retail sales. Estimating future returns requires judgment based on current and historical trends and actual returns may vary from our estimates.
In evaluating the timing of the transfer of control of products to customers, the Company considers several control indicators, including significant risks and rewards of products, the Company’s right to payment and the legal title of the products. Based on the assessment of control indicators, product sales are typically recognized when they are made available to the carrier or are picked up by the customer. Promises related to product installation are considered a separate performance obligation from the product sale given the products can be used without customization or modification, installation is not complex and can be performed by other vendors. Installation revenue is recognized upon completion of the installation service to the customer. Sales and other taxes collected concurrent with revenue producing activities are excluded from revenue. Payment for goods and services sold by the Company is typically due upon satisfaction of the performance obligations.
The Company's sales vary by the type of products that are sold between consumables and non-consumables. Due to their nature, purchases of consumables typically result in repeat orders as customers seek to replenish their supplies. Generally, in new markets where legalization of plant-based medicines is recent and licensors are starting new grow operations, there are more purchases of non-consumables for facility buildouts compared to purchases of recurring consumables. In more mature markets, there are generally more purchases of consumables than non-consumables. Our sales are also impacted by our customer mix of commercial and non-commercial customers, as commercial customers typically purchase more
product and may receive volume discounts and other promotions. A majority of our sales are derived from commercial customers. In addition, the Company serves customers that are other wholesalers and resellers of both consumables and non-consumables.
Cost of Sales
Cost of sales includes cost of goods and shipping costs. Cost of goods consists of cost of merchandise, inbound freight and other inventory-related costs, such as shrinkage costs and lower of cost or market adjustments. Occupancy expenses, which consist of payroll, rent and other lease required costs, including common area maintenance and utilities, are included as a component of store operations and other operational expenses on the consolidated statements of operations.
Gross Profit
We calculate gross profit as sales less cost of sales. Cost of sales consists of cost of product sold, freight, tariffs, inventory shrink and obsolescence. Gross profit excludes depreciation and amortization, which are presented separately in our consolidated statements of operations.
Our overall gross profit margin varies with our product mix, in particular the percentage of sales of consumable products, which are products that are used regularly in daily growing operations, versus non-consumable products, which are products that are one-time purchases, such as in connection with commercial facility buildouts. Our customer mix also impacts gross profit margin due to larger commercial customers receiving discounts. In addition, costs incurred for logistics, obsolescence, inventory adjustments, and vendor purchase discounts impact reported gross margin.
Operating Expenses
Operating expenses are comprised of store operations, primarily payroll, rent and utilities, and corporate overhead. Corporate overhead is comprised of share-based compensation, depreciation and amortization, selling, general and administrative costs and corporate salaries and related expenses. Selling, general, and administrative expenses (“SG&A”) consist mainly of advertising and promotions, travel & entertainment, professional fees, and insurance. SG&A as a percentage of sales does not increase commensurate with an increase in sales. Our largest expenses are payroll and rent, which are largely fixed and not variable. Our advertising and marketing expenses are controllable and variable depending on the particular market.
Same-Store Sales
We assess the organic growth of our sales on a same-store basis. We believe that our assessment on a same-store basis represents an important indicator of comparative financial results and provides relevant information to assess our performance. New and acquired stores become eligible for inclusion in the comparable store base if the store has been under our ownership for the entire period in the same-store base periods for which we are including the store. Closed stores become ineligible for inclusion in the comparable store base in the month in which operations cease.
Research and Development
The Company has not incurred any research and development expenses during the period covered by this report.
CUSTOMERS AND SUPPLIERS
Our key customers vary by state and segment. No customer accounted for more than 5% of revenues for the years ended December 31, 2022, 2021, and 2020. Three customers represented 28% of total accounts receivable as of December 31, 2022.
Our key suppliers include several manufacturers and distributors such as Hawthorne Garden Supply, Athena, Grodan, Hydrofarm, Canna Continental, and others. All the products purchased and sold are applicable to indoor and outdoor growing for organics, greens, and plant-based medicines. One supplier represented 24% and 28% of our total vendor purchases for the years ended December 31, 2022 and 2021, and 2 suppliers represented 41% of our total vendor purchases for the year ended December 31, 2020. Although the Company expects to maintain relationships with these vendors, the loss of either supplier would not be expected to have a material adverse impact on our business because of the competitive nature of the products that we sell. The Company also maintains direct manufacturing agreements with certain vendors.
ACQUISITIONS
2022 Acquisitions
On February 1, 2022, the Company purchased the assets of HRG, a specialty marketing and sales organization of horticultural products based in Ogden, Utah. The total consideration for the purchase of the assets of HRG was approximately $13.4 million, including $6.8 million in cash and common stock valued at approximately $5.7 million. The Asset Purchase Agreement provides for an indemnity holdback to be settled in common stock of the Company valued at approximately $0.9 million. Acquired goodwill represents the value expected to rise from organic growth and an opportunity to expand into a well-established market for the Company. HRG is included in our Distribution and other segment.
On November 3, 2022, the Company purchased certain assets of St. Louis Hydroponic Company ("STL"), a hydroponic retail store in St. Louis, Missouri. The total consideration for the purchase of the assets of STL was approximately $0.4 million in cash. Acquired goodwill of approximately $0.1 million represents the value expected to rise from organic growth and an opportunity to expand into a well-established market for the Company. STL is included in our Retail segment.
2021 Acquisitions
On January 25, 2021, the Company purchased the assets of Indoor Garden & Lighting, Inc ("Indoor Garden"), a two-store chain of hydroponic and indoor gardening equipment and supply stores serving the Seattle and Tacoma, Washington area. The total consideration for the purchase of Indoor Garden was approximately $1.7 million, including approximately $1.2 million in cash and common stock valued at approximately $0.5 million. Acquired goodwill of approximately $0.7 million represents the value expected to arise from organic growth and an opportunity to expand into a well-established market for the Company. Indoor Garden is included in our Retail segment.
On February 1, 2021, the Company purchased the assets of J.A.R.B., Inc d/b/a Grow Depot Maine ("Grow Depot Maine"), a two-store chain in Auburn and Augusta, Maine. The total consideration for the purchase of Grow Depot Maine was approximately $2.1 million, including approximately $1.7 million in cash and common stock valued at approximately $0.4 million. Acquired goodwill of approximately $0.9 million represents the value expected to rise from organic growth and an opportunity to expand into a well-established market for the Company. Grow Depot Maine is included in our Retail segment.
On February 15, 2021, the Company purchased the assets of Grow Warehouse LLC ("Grow Warehouse"), a four-store chain of hydroponic and organic garden stores in Colorado (3) and Oklahoma (1). The total consideration for the purchase of Grow Warehouse was approximately $17.8 million, including approximately $8.1 million in cash and common stock valued at approximately $9.7 million. Acquired goodwill of approximately $11.1 million represents the value expected to rise from organic growth and an opportunity to expand into a well-established market for the Company. Grow Warehouse is included in our Retail segment.
On February 22, 2021, the Company purchased the assets of San Diego Hydroponics & Organics ("San Diego Hydro"), a four-store chain of hydroponic and organic garden stores in San Diego, California. The total consideration for the purchase of San Diego Hydro was approximately $9.3 million, including approximately $4.8 million in cash and common stock valued at approximately $4.5 million. Acquired goodwill of approximately $5.7 million represents the value expected to rise from organic growth and an opportunity to expand into a well-established market for the Company. San Diego Hydro is included in our Retail segment.
On March 12, 2021, the Company purchased the assets of Charcoir Corporation ("Charcoir"), which sells an RHP-certified growing medium made from the highest-grade coconut fiber. The total consideration for the purchase of Charcoir was approximately $16.4 million, including approximately $9.9 million in cash and common stock valued at approximately $6.5 million. Acquired goodwill of approximately $6.1 million represents the value expected to rise from organic growth and an opportunity to expand into a well-established distribution market for the Company of a proprietary brand. Charcoir is included in our Distribution and other segment.
On March 15, 2021, the Company purchased the assets of 55 Hydroponics ("55 Hydro"), a hydroponic and organic superstore located in Santa Ana, California. The total consideration for the purchase of 55 Hydro was approximately $6.5 million, including approximately $5.3 million in cash and common stock valued at approximately $1.1 million. Acquired goodwill of approximately $3.9 million represents the value expected to rise from organic growth and an opportunity to expand into a well-established market for the Company. 55 Hydro is included in our Retail segment.
On March 15, 2021, the Company purchased the assets of Aquarius Hydroponics ("Aquarius"), a hydroponic and organic garden store in Springfield, Massachusetts. The total consideration for the purchase of Aquarius was approximately $3.6 million, including approximately $2.3 million in cash and common stock valued at approximately $1.2 million. Acquired goodwill of approximately $1.7 million represents the value expected to rise from organic growth and an opportunity to expand into a well-established market for the Company. Aquarius is included in our Retail segment.
On March 19, 2021, the Company purchased the assets of Agron, LLC, ("Agron") an online seller of growing equipment. The total consideration for the purchase of Agron was approximately $11.2 million, including approximately $6.0 million in cash and common stock valued at approximately $5.3 million. Acquired goodwill represents the value expected to rise from organic growth and an opportunity to expand into a well-established e-commerce market for the Company targeting the commercial customer. Agron is included in our E-commerce segment.
On April 19, 2021, the Company purchased the assets of Grow Depot LLC ("Down River Hydro"), a hydroponic and indoor gardening supply store in Brownstown, Michigan. The total consideration for the purchase of Down River Hydro was approximately $4.4 million, including approximately $3.2 million in cash and common stock valued at approximately $1.2 million. Acquired goodwill represents the value expected to rise from organic growth and an opportunity to expand into a well-established market for the Company. Down River Hydro is included in our Retail segment.
On May 24, 2021, the Company purchased the assets of The Harvest Company ("Harvest"), a northern California-based hydroponic supply center and cultivation design innovator with stores in Redding and Trinity Counties. The total consideration for the purchase of Harvest was approximately $8.3 million, including approximately $5.6 million in cash and common stock valued at approximately $2.8 million. Acquired goodwill represents the value expected to rise from organic growth and an opportunity to expand into a well-established market for the Company. Harvest is included in our Retail segment.
On July 19, 2021, the Company purchased the assets of Aqua Serene, Inc., ("Aqua Serene"), an Oregon corporation which consists of an indoor/outdoor garden center with stores in Eugene and Ashland, Oregon. The total consideration for the purchase was approximately $11.7 million, including approximately $9.9 million in cash and common stock valued at approximately $1.8 million. Acquired goodwill represents the value expected to rise from organic growth and an opportunity to expand into a well-established market for the Company. Aqua Serene is included in our Retail segment.
On July 3, 2021, the Company purchased the assets of Mendocino Greenhouse & Garden Supply, Inc ("Mendocino"), a Northern California-based hydroponic garden center located in Mendocino, California. The purchase agreement was modified on July 19, 2021 to amend the purchase price. The total consideration for the purchase was $4.0 million in cash. Acquired goodwill represents the value expected to rise from organic growth and an opportunity to expand into a well-established market for the Company. Mendocino is included in our Retail segment.
On August 24, 2021, the Company purchased the assets of Commercial Grow Supply, Inc. ("CGS"), a hydroponic superstore located in Santa Clarita, California. The total consideration for the purchase was approximately $7.2 million, including approximately $6.0 million in cash and common stock valued at approximately $1.3 million. Acquired goodwill represents the value expected to rise from organic growth and an opportunity to expand into a well-established market for the Company. CGS is included in our Retail segment.
On August 23, 2021 the Company purchased the assets of Hoagtech Hydroponics, Inc. ("Hoagtech"), a Washington -based corporation consisting of a hydroponic and garden supply center serving the Bellingham, Washington area. The total consideration for the purchase was approximately $3.9 million in cash. The Asset Purchase Agreement contains a contingent payment equal to $0.6 million to be settled in common stock of the Company if this garden supply center reaches $8.0 million in revenue within a 12-month calendar period from the date of close. The Company used a third-party specialist to value this contingent consideration. The probability that the target will be reached was determined to be 5%, resulting in a value of approximately $28.5 thousand of contingent consideration, which was added to goodwill. Acquired goodwill represents the value expected to rise from organic growth and an opportunity to expand into a well-established market for the Company.Hoagtech is included in our Retail segment.
On October 15, 2021, the Company purchased the assets of Indoor Store, LLC ("All Seasons Gardening"), an indoor-outdoor garden supply center specializing in hydroponics systems, lighting, and nutrients. All Seasons Gardening is the largest hydroponics retailer in New Mexico. The total consideration for the purchase was approximately $0.9 million, including approximately $0.7 million in cash and common stock valued at approximately $0.2 million. Acquired goodwill represents the value expected to rise from organic growth and an opportunity to expand into a well-established market for the Company. All Seasons Gardening is included in our Retail segment.
On December 31, 2021, the Company purchased the assets of Mobile Media, Inc ("MMI"), a mobile shelving manufacturing and warehouse facility. The total consideration for the purchase was approximately $9.1 million, including approximately $8.3 million in cash and common stock valued at approximately $0.8 million. Acquired goodwill represents the value expected to rise from organic growth and an opportunity to expand into a well-established market for the Company. MMI is included in our Distribution and other segment.
2020 Acquisitions
On February 26, 2020 the Company purchased the assets of Health & Harvest LLC ("Health & Harvest"). The total consideration for the purchase was approximately $2.9 million, including approximately approximately $1.8 million in cash and common stock valued at approximately $1.1 million. Acquired goodwill represents the value expected to rise from organic growth and the opportunity to expand into a well-established market for the Company.
On June 16, 2020, we acquired certain assets of H2O Hydroponics, LLC (“H2O Hydro”). The total consideration for the purchase was approximately $2.0 million, including approximately $1.3 million in cash and common stock valued at approximately $0.7 million. Acquired goodwill represents the value expected to rise from organic growth and the opportunity to expand into a well-established market for the Company.
On August 10, 2020 we acquired certain assets of Benzakry Family Corp, d/b/a Emerald City Garden (“Emerald City”). The total consideration for the purchase was approximately $1.0 million. Acquired goodwill represents the value expected to rise from organic growth and the opportunity to expand into a well-established market for the Company.
On October 12, 2020, the Company acquired the assets of Hydroponics Depot, LLC (“Hydro Depot”), a single store located in Phoenix, AZ. The total consideration for the purchase was approximately $1.5 million, including approximately $1.0 million in cash and common stock valued at approximately $0.5 million. Acquired goodwill represents the value expected to rise from organic growth and the opportunity to expand into a well-established market for the Company.
On October 20, 2020 the Company acquired the assets of Big Green Tomato (“BGT”), a two-store chain in Battle Creek and Taylor, Michigan. The total consideration was approximately $9.0 million, including approximately $6.0 million in cash and common stock valued at approximately $3.1 million. Acquired goodwill of approximately $4.0 million represents the value expected to rise from organic growth and an opportunity to expand into a well-established market for the Company.
On November 17, 2020, the Company acquired the assets of The GrowBiz (“GrowBiz”), a five-store chain with four stores in California and one store in Oregon. The total consideration for the purchase of GrowBiz was approximately $44.8 million, including approximately $17.5 million in cash and common stock valued at approximately $27.3 million. Acquired goodwill of approximately $28.5 million represents the value expected to rise from organic growth and an opportunity to expand into a well-established market for the Company.
On December 14, 2020, the Company acquired the assets of Grassroots Hydroponics, Inc. ("Grassroots"), a three-store chain in California. The total consideration for the purchase of Grassroots was approximately $10.0 million, including approximately $7.5 million in cash and common stock valued at approximately $2.5 million. Acquired goodwill of approximately $4.5 million represents the value expected to rise from organic growth and an opportunity to expand into a well-established market for the Company.
On December 23, 2020, the Company acquired the assets of Canopy Crop Management (“Canopy”) and its complete portfolio of products including the Power SI brand of silicic acid-enriched fertilizers. The total consideration for the purchase of Canopy was approximately $9.2 million, including approximately $5.4 million in cash and common stock valued at approximately $3.8 million. Acquired goodwill of approximately $4.9 million represents the value expected to rise from organic growth and an opportunity to expand into a well-established product distribution market for the Company.
For further detail on all acquisitions please see Note 16 in the notes to consolidated financial statements.
SEASONALITY
Our business is subject to some seasonal influences. Historically, our highest volume of sales occurs in our second and third fiscal quarters, primarily based on the outdoor growing seasons, and the lower volume occurs during our first or fourth fiscal quarters.
COMPETITION
The markets in which we sell our products are highly competitive. Our key competitors include many local and national vendors of gardening supplies, local product resellers of hydroponic and other specialty growing equipment, and online product resellers and large online marketplaces such as Amazon and eBay. Our industry is highly fragmented, with over 1,000 hydroponic retailers throughout the U.S. by management's estimates.
Notwithstanding the foregoing, we are the largest chain of hydroponic garden centers in the U.S. by management's estimates, and our pricing, inventory and product availability and overall customer service provide us the ability to compete in our industry. In addition, as we continue to increase the scope of our operations, including both retail and distribution, we expect to continue to purchase inventory at lower volume prices, which we expect will enable us to price competitively and deliver the products that our customers are seeking. The Company competes by delivering a one-stop shopping experience that includes the widest selection of hydroponics products, end-to-end solutions for all types of cultivation environments, in-store sales and product support, direct manufacturer pricing and industry-leading expertise and customer service.
INTELLECTUAL PROPERTY
Our intellectual property includes our brands and their related trademarks, domain names and websites, customer lists and affiliations, product knowledge and technology, patents, and marketing intangibles. We also hold rights to website addresses related to our business including websites that are actively used in our day-to-day business such as www.GrowGeneration.com. We own several the federally registered trademarks, including for “GrowGeneration®” and “Where the Pros Go to Grow®” as well as our proprietary brands.
MARKET DEVELOPMENT AND GOVERNMENT REGULATION
We sell products, including hydroponic gardening products, that end users may purchase for use in new and emerging industries or segments, including the growing of cannabis and hemp, that may not grow or achieve market acceptance in a manner that we can predict. Demand for these products depends on the uncertain growth of these industries or segments.
In addition, we sell products that end users may purchase for use in industries or segments, including the growing of cannabis and hemp, that are subject to varying, inconsistent, and rapidly changing laws, regulations, administrative practices, enforcement approaches, judicial interpretations, and consumer perceptions. For example, 37 U.S. states, as well as four U.S. territories and the District of Columbia, have adopted frameworks that authorize, regulate, and tax the cultivation, processing, sale, and use of cannabis for medicinal and/or non-medicinal use, while the U.S. Controlled Substances Act and the laws of other U.S. states prohibit some or all such activities. Notwithstanding this conflicted legal landscape, we believe that there is a continuing trend towards further legalization that will allow the Company to expand its marketplace opportunities.
Our gardening products, including our hydroponic gardening products, are multi-purpose products designed and intended for growing a wide range of plants and are purchased by cultivators who may grow any variety of plants, including cannabis and hemp. Although the demand for our products may be negatively impacted depending on how laws (including federal legalization of cannabis), regulations, administrative practices, enforcement approaches, judicial interpretations, and consumer perceptions develop, we cannot reasonably predict the nature of such developments or the effect, if any, that such developments could have on our business.
HUMAN CAPITAL RESOURCES
We strive to foster a collaborative and team-oriented culture and view our human capital resources as an ongoing priority. As of March 1, 2023, we employ 455 employees: 429 full-time employees, 26 part-time employees, and no temporary or seasonal workers. None of our employees are subject to collective bargaining agreements, and we have had no labor-related work stoppages. We believe we offer competitive terms and incentives to attract and retain employees, including employer contributions to health and welfare benefits, 401(k) plan matching, bonus programs, employee discounts and training opportunities. In late 2021, we also engaged a compensation consultant to ensure our key employee compensation packages are competitive.
ITEM 1A. RISK FACTORS
RISKS RELATING TO OUR BUSINESS
Acquisitions, strategic alliances and other investments could result in operating difficulties, dilution, and other consequences that may adversely impact our business and results of operations.
Acquisitions are an important element of our overall corporate strategy, and these transactions could entail material investments by us and be material to our financial condition and results of operations. We expect to evaluate and enter into discussions regarding a wide array of potential strategic transactions. The process of integrating an acquired company, business, or product has created, and will continue to create, unforeseen operating difficulties and expenditures. The areas where we face risks may include, but are not limited to:
•diversion of management’s time and focus from operating our business to acquisition integration challenges;
•failure to successfully further develop the acquired business or products;
•implementation or remediation of controls, procedures and policies at the acquired company;
•integration of the acquired company’s accounting, human resources and other administrative systems, and coordination of product, engineering and sales and marketing functions;
•transition of operations, users and customers onto our existing platforms;
•failure to recognize expected synergies from an acquisition;
•reliance on the expertise of our strategic partners with respect to market development, sales, local regulatory compliance and other operational matters;
•failure to obtain required governmental approvals on a timely basis, if at all, or conditions placed upon approval, under competition and antitrust laws, could, among other things, delay or prevent us from completing a transaction or otherwise restrict our ability to realize expected financial or strategic goals of an acquisition;
•cultural challenges associated with integrating employees from the acquired company into our organization, and retention of employees from the businesses we acquire;
•liability for or reputational harm from activities of the acquired company before the acquisition or from our strategic partners, including patent and trademark infringement claims, violations of laws, commercial disputes, tax liabilities and other known and unknown liabilities; and
•litigation or other claims in connection with the acquired company, including claims from terminated employees, customers, former stockholders or other third parties.
Our due diligence may fail to identify all liabilities and risks associated with acquisitions and we may not accurately assess the relative benefits and detriments of making an acquisition and may pay acquisition consideration exceeding the value of the acquired business. Our failure to address these risks or other problems encountered in connection with our past or future acquisitions and investments or strategic alliances could cause us to fail to realize the anticipated benefits of such acquisitions, investments or alliances, incur unanticipated liabilities, and harm our business generally.
Our acquisitions could also result in dilutive issuances of our equity securities, the incurrence of debt, contingent liabilities or amortization expenses, or impairment of goodwill and purchased long-lived assets, and restructuring charges, any of which could harm our financial condition or results of operations and cash flows.
Although acquisitions are an important element of our overall corporate strategy, there can be no assurance that we will be able to identify appropriate acquisition targets, successfully acquire identified targets or successfully integrate the business of acquired companies to realize the full, anticipated benefits of such acquisitions.
Economic conditions could adversely affect our business.
Uncertain economic conditions both in the U.S. and globally, driven by circumstances such as rising interest rates, uncertainty around cannabis reforms at the federal level, war in Ukraine and lingering effects of the COVID-19 pandemic, could adversely affect our business. Negative global economic trends, such as decreased consumer and business spending, high inflation and interest rates and declining consumer and business confidence, pose challenges to our business and could result in declining revenues, profitability and cash flow. Although we continue to devote significant resources to support our brands, unfavorable economic conditions may negatively affect demand for our products.
We face competition that could prohibit us from developing or increasing our customer base.
The specialty gardening and hydroponic product industry is highly competitive. More established gardening companies with much greater financial resources which do not currently compete with us may be able to easily adapt their existing operations to sales of hydroponic growing equipment. Our competitors may also introduce new hydroponic growing equipment, and manufacturers may sell equipment direct to consumers. Due to this competition, there is no assurance that
we will not encounter difficulties in increasing revenues and maintaining and/or increasing market share. In addition, increased competition may lead to reduced prices and/or margins for products we sell.
As a public company, we are obligated to develop and maintain proper and effective internal controls over financial reporting, and any failure to maintain the adequacy of these internal controls may adversely affect investor confidence in our company and, as a result, the value of our common stock.
Section 404 of the Sarbanes-Oxley Act of 2002 and the related rules and regulations of the SEC require an annual management assessment of the effectiveness of our internal control over financial reporting. We have hired additional accounting and financial staff, and leveraged outside resources, with appropriate public company experience and technical accounting knowledge to compile the system and process documentation necessary to perform the evaluation needed to comply with Section 404.
During the evaluation and testing process of our internal controls, we identified material weaknesses in our internal control over financial reporting and are therefore unable to certify that our internal control over financial reporting is effective. We cannot assure you that there will not be material weaknesses or significant deficiencies in our internal control over financial reporting in the future. Any failure to maintain internal control over financial reporting could severely inhibit our ability to accurately report our financial condition or results of operations. If we are unable to conclude that our internal control over financial reporting is effective, or if our independent registered public accounting firm determines that we have a material weakness or significant deficiency in our internal control over financial reporting, we could lose investor confidence in the accuracy and completeness of our financial reports, the market price of our common stock could decline, and we could be subject to sanctions or investigations by the SEC or other regulatory authorities. Failure to remedy any material weakness in our internal control over financial reporting, or to implement or maintain other effective control systems required of public companies, could also restrict our future access to the capital markets.
We identified material weaknesses in our internal control over financial reporting, and if we are unable to achieve and maintain effective internal control over financial reporting, the accuracy and timing of our financial reporting may be adversely affected.
As part of management's independent assessment, we identified material weaknesses in our internal control over financial reporting and our independent registered public accounting firm issued an adverse opinion on internal control over financial reporting.
A “material weakness” is a deficiency, or a combination of deficiencies, in internal control over financial reporting such that there is a reasonable possibility that a material misstatement of our annual or interim consolidated financial statements will not be prevented or detected on a timely basis. Our management identified certain material weaknesses as discussed in Item 9A of this report. These material weaknesses could result in a misstatement of account balances or disclosures that would result in a material misstatement to the annual or interim financial statements that would not be prevented or detected.
We have taken several actions towards remediating these material weaknesses as discussed in Item 9A of this report. Although we have taken steps to address the material weaknesses, we are still in the process of completing the remediation and the steps we are taking may not be sufficient to remediate our material weaknesses or prevent future material weaknesses or significant deficiencies from occurring.
We can give no assurance that additional material weaknesses in our internal control over financial reporting will not be identified in the future. Our failure to implement and maintain effective internal control over financial reporting could result in errors in our consolidated financial statements that could result in a restatement of our consolidated financial statements and cause us to fail to meet our reporting obligations.
If we are unable to hire and retain employees, we may not be able to implement our business plan and our business may be materially adversely affected.
Our future success depends to a large extent on our ability to attract, hire, train and retain qualified managerial, operational and other personnel. At present, we believe we have the necessary key personnel to carry out our business plans, but if we are unable to hire and retain qualified personnel, our business will be materially adversely affected. We face significant competition for diverse, qualified and experienced employees in our industry and from other industries and, as a result, we may be unable to attract and retain the personnel needed to successfully conduct and grow our operations. The COVID-19 pandemic and inflation have exacerbated these risks, and the impact on labor markets may continue to disrupt our ability to attract and retain personnel for an extended period of time. In addition, we do not maintain key man life insurance on any of our executive officers and directors. Key personnel, including members of management, may leave and compete against us, or may not perform well in their roles with us. If one or more of our executive officers are unable or unwilling to
continue in their present positions, we may not be able to replace them readily, if at all, and may face disruption in our operations and incur additional expenses, including to recruit and retain new talent, as a result.
Litigation may adversely affect our business, financial condition and results of operations.
From time to time in the normal course of our business operations, we may become subject to litigation that may result in liability material to our consolidated financial statements as a whole or may negatively affect our operating results if changes to our business operation are required. The cost to defend such litigation may be significant and may require a diversion of our resources. There also may be adverse publicity associated with litigation that could negatively affect customer, vendor and industry perception of our business, regardless of whether the allegations are valid or whether we are ultimately found liable. As a result, litigation may adversely affect our business, financial condition and results of operations.
There can be no assurance that future developments related to pending claims or claims filed in the future, whether as a result of adverse outcomes or as a result of significant defense costs, will not have a material effect on our financial condition, results of operations or cash flows. We believe that our assessment of contingencies is reasonable and that the related accruals, in the aggregate, are adequate; however, there can be no assurance that the final resolution of these matters will not have a material effect on our financial condition, results of operations or cash flows.
See Item 3. Legal Proceedings for discussion of current legal proceedings and accruals.
The COVID-19 pandemic and the efforts to mitigate its impact may have an adverse effect on our business, liquidity, results of operations, financial condition and price of our securities.
The pandemic involving the novel strain of coronavirus, or COVID-19, including mutations and variants thereof, and the measures taken to combat it, may have an adverse effect on our business. Public health authorities and governments imposed, altered and/or revoked various measures to respond to this pandemic. Some measures that directly or indirectly impacted our business include:
•voluntary or mandatory quarantines;
•restrictions on travel;
•public health directives and testing and vaccine mandates;
•social distancing measures; and
•supply chain disruptions, including increased cost of freight and inventory and delays in the delivery of our inventory.
Although many impacts of the COVID-19 pandemic appear to have alleviated, the pandemic has not yet been eliminated, and we cannot predict future impacts of the COVID-19 pandemic, if any, on markets generally or on our operations or the operations of our customers and suppliers. It is possible that some impacts of the pandemic on markets will persist for some time. These measures have negatively impacted, and may continue to impact, our business and financial condition as the responses to control COVID-19 continue.
We may not successfully develop new products or improve existing products, or successfully manage various risks that we may be exposed to in connection with our proprietary brand offerings.
We expect to continue to grow our portfolio of proprietary brand offerings and have invested in development and procurement resources and marketing efforts relating to our proprietary brand offerings to meet evolving consumer needs and regulatory requirements. We may not be successful in developing, manufacturing and marketing new products or product innovations that satisfy consumer needs or regulatory requirements in a timely manner. If we fail to successfully develop, manufacture and market new products or product innovations, or if we fail to reach existing and potential consumers, our ability to maintain or grow our market share may be adversely affected, which in turn could materially adversely affect our business, financial condition and results of operations. In addition, the development and introduction of new products and product innovations require development and marketing expenditures, which we may not recoup if such new products or innovations do not achieve market acceptance.
Although we believe that our proprietary brand products offer value to our customers at each price point and provide us with higher gross margins than comparable third-party branded products we sell, the expansion of our proprietary brand offerings also subjects us to certain specific risks in addition to those discussed elsewhere in this section, such as:
•Potential mandatory or voluntary product recalls;
•Increased regulatory compliance burdens and potential product liability exposure;
•Potential competition with our vendors’ products, which may adversely affect our vendor relationships;
•Our ability to successfully obtain, maintain, protect and enforce our intellectual property and proprietary rights (including defending against counterfeit, grey-market, infringing or otherwise unauthorized goods); and
•Our ability to successfully navigate and avoid claims related to the proprietary rights of third parties.
Third parties may initiate legal proceedings alleging that we are infringing their intellectual property rights, the outcome of which would be uncertain and could have a material adverse effect on the success of our business.
As a result of building and continuing to build our proprietary brands and new product technologies, we may become party to, or threatened with, adversarial proceedings or litigation regarding intellectual property or proprietary rights with respect to our products and technology, including proceedings before the U.S. Patent and Trademark Office and/or non-U.S. opposition proceedings. A successful claim of trademark, patent or other intellectual property or proprietary right infringement, misappropriation or other violation against us, or any other successful challenge to the use of our intellectual property and proprietary rights, could subject us to damages or prevent us from providing certain products or services, or using certain of our recognized brand names, which could have a material adverse effect on our business, financial condition and results of operations. As a result of any such infringement claims, or other intellectual property claims, regardless of merit, or to avoid potential claims, we may choose or be compelled to seek intellectual property licenses from third parties. These licenses may not be available on acceptable terms, or at all. Any such license would likely obligate us to pay license fees, royalties, minimum royalties and/or milestone payments and the rights granted to us could be nonexclusive, which would mean that our competitors may be able to obtain licenses to the same intellectual property. Ultimately, we could be prevented from commercializing a product and/or technology or be forced to cease some aspect of our business operations if, as a result of actual or threatened infringement or other intellectual property claims, we are unable to enter into licenses of the relevant intellectual property on acceptable terms. Further, if we attempt to modify a product and/or technology or to develop alternative methods or products in response to infringement or other intellectual property claims or to avoid potential claims, we could incur substantial costs, encounter delays in product introductions or interruptions in sales.
If our owned or in-licensed trademarks and trade names are not adequately protected, then we may not be able to build name recognition in our markets of interest and our business may be adversely affected.
The registered or unregistered trademarks, trade names and service marks that we own or in-license from third parties may be challenged, infringed, circumvented, declared generic or determined to be infringing on or dilutive of other marks. Additionally, at times, competitors may adopt trademarks, trade names or service marks similar to the ones we own or in-license, thereby impeding our ability to build brand identity and possibly leading to market confusion. In addition, there could be potential trademark, trade name or service mark infringement claims brought against us or our licensors by owners of other trademarks, trade names and service marks. If we are unable to establish name recognition based on our owned and in-licensed trademarks and trade names, then we may not be able to compete effectively and our business may be adversely affected. We may also license our trademarks, trade names and service marks out to third parties, such as our distributors. Though these license agreements may provide guidelines for how our trademarks, trade names and service marks may be used, a breach of these agreements or misuse of our trademarks, trade names and service marks by our licensees may jeopardize our rights in or diminish the goodwill associated with our trademarks and trade names. Any efforts to enforce or protect our intellectual property and proprietary rights related to trademarks, trade names and service marks may be ineffective and could result in substantial costs and diversion of resources and could adversely affect our business, financial condition, results of operations and prospects.
Compliance with, or violation of, environmental, health and safety laws and regulations, including laws pertaining to the use of pesticides, could result in significant costs that adversely impact our reputation, businesses, financial position, results of operations and cash flows.
International, federal, state, provincial and local laws and regulations relating to environmental, health and safety matters affect us in several ways in light of the ingredients that are used in products included in our growing media and nutrients product lines. In the U.S., products containing pesticides generally must be registered with the Environmental Protection Agency ("EPA"), and similar state agencies before they can be sold or applied. The failure by us or one of our business relationships to obtain or the cancellation of any such registration, or the withdrawal from the marketplace of such pesticides, could have an adverse effect on our businesses, the severity of which would depend on the products involved, whether other products could be substituted and whether our competitors were similarly affected. The pesticides we use are either granted a license by the EPA or exempt from such a license and may be evaluated by the EPA as part of its ongoing exposure risk assessment. The EPA may decide that a pesticide we distribute will be limited or will not be re-registered for use in the U.S. We cannot predict the outcome or the severity of the effect on our business of any future evaluations, if any, conducted by the EPA.
In addition, certain of our pesticide products are subject to complex and overlapping laws and regulation by various international, federal, state, provincial and local environmental and public health agencies. Even if we are able to comply with all such laws and regulations and obtain all necessary registrations and licenses, the pesticides or other products could
nonetheless be alleged to cause injury to the environment, to people or to animals, or such products could be banned in certain circumstances. The costs of compliance, noncompliance, investigation, remediation, combating reputational harm or defending civil or criminal proceedings, products liability, personal injury or other lawsuits could have a material adverse impact on our reputation, businesses, financial position, results of operations and cash flows.
If product liability lawsuits are brought against us, we may incur substantial liabilities.
We face a potential risk of product liability as a result of any of the products that we offer for sale. For example, we may be sued if any product we sell allegedly causes injury or is found to be otherwise unsuitable during product testing, manufacturing, marketing or sale. Any such product liability claims may include allegations of defects in manufacturing, defects in design, a failure to warn of dangers inherent in the product, negligence, strict liability and a breach of warranties. Claims could also be asserted under state consumer protection acts. If we cannot successfully defend ourselves against product liability claims, we may incur substantial liabilities. Even successful defense could require significant financial and management resources. Regardless of the merits or eventual outcome, liability claims may result in:
•decreased demand for products that we may offer for sale;
•injury to our reputation;
•costs to defend the related litigation;
•a diversion of management’s time and our resources;
•substantial monetary awards to trial participants or patients;
•product recalls, withdrawals or labeling, marketing or promotional restrictions; and
•a decline in our stock price.
We do not maintain any product liability insurance. Our inability to obtain and retain sufficient product liability insurance at an acceptable cost to protect against potential product liability claims could prevent or inhibit the commercialization of products we developed. Even if we obtain product liability insurance in the future, we may have to pay amounts awarded by a court or negotiated in a settlement that exceed our coverage limitations or that are not covered by our insurance, and we may not have, or be able to obtain, sufficient capital to pay such amounts.
Our operations may be impaired if our information technology systems, or those of our third-party vendors, fail to perform adequately or if we or our third-party vendors are the subject of a data breach or cyber-attack.
We rely on information technology systems to conduct business, including communicating with employees and our distribution centers, ordering and managing materials from suppliers, selling and shipping products to retail customers and analyzing and reporting results of operations, as well as for storing sensitive, personal and other confidential information. While we have taken steps to ensure the functionality and security of our information technology systems, our measures or those of our third-party vendors may not be effective and our or our third-party vendors’ systems may nevertheless be vulnerable to computer viruses, security breaches and other disruptions from unauthorized users, as well as failures of such systems to operate as expected. In addition, as we replace or upgrade our technology systems, or integrate new systems, issues may arise, such as failure of such systems to perform as expected, that disrupt our business and cause us to incur unanticipated expenditures. If our or our third-party vendors’ information technology systems are damaged or cease to be available or function properly, whether as a result of a significant cyber incident or otherwise, our ability to communicate, coordinate supply chain, inventory and ordering, manage internal and external reporting, and operate quality controls and internal controls could be significantly impaired, which may adversely impact our business.
Additionally, the techniques used to obtain unauthorized, improper or illegal access to information technology systems are constantly evolving, may be difficult to detect quickly and often are not recognized until after they have been launched against a target. We may be unable to anticipate these techniques, react in a timely manner or implement adequate preventative or remedial measures. Any operational failure or breach of security from these increasingly sophisticated cyber threats could lead to the loss or disclosure of both our and third-party information, which could result in expensive and time-consuming regulatory or other legal proceedings and have a material adverse effect on our business and reputation. In addition, we may incur significant costs and operational consequences in connection with investigating, mitigating, remediating, eliminating and putting in place additional tools and devices designed to prevent future actual or perceived security incidents, as well as in connection with complying with any notification or other obligations resulting from any security incidents. Because we do not control our third-party vendors, or the processing of data by our third-party vendors, our ability to monitor our third-party vendors’ data security is limited and we cannot ensure the integrity or security of the measures they take to protect and prevent the loss of our or our consumers’ data. As a result, we are subject to the risk that cyber-attacks on, or other security incidents affecting, our third-party vendors may adversely affect our business even if an attack or breach does not directly impact our systems.
Cost-cutting measures could be insufficient to drive profitability and could have unanticipated negative consequences, including hindering strategic initiatives and future growth of our business.
In response to a significant and prolonged industry downturn, the Company has undergone and expects to continue to undergo various cost-cutting measures, including store consolidations and staffing reductions. While management believes such measures are prudent to improve results, they may not be sufficient to return the Company to profitability. In addition, cost-cutting measures may have unanticipated negative consequences, such as customer and employee attrition. Reducing costs also means fewer resources are available for strategic initiatives and operational improvements to support future growth once demand recovers, such as improvements to supply chain operations and information technology systems, which could have a negative impact on our business and results of operations.
We may be required to record impairment charges against the carrying value of our goodwill and other intangible assets in the future.
We are required to test for impairment of the carrying value of our goodwill and intangible assets at least annually and whenever evidence of impairment exists. We have recorded impairment charges in the current year. We may be required in the future to record additional impairment charges that could have a material adverse effect on our reported results.
We occupy many of our facilities under long-term non-cancellable leases, and we may be unable to renew our leases at the end of their terms.
Many of our facilities and distribution centers are located on leased premises subject to non-cancellable leases. Typically, our leases have initial terms ranging from three to ten years, with options to renew for specified periods of time. We believe that our future leases will likely also be long-term and non-cancellable and have similar renewal options. If we close or stop fully utilizing a facility, we will most likely remain obligated to perform under the applicable lease, which would include, among other things, making the base rent payments, and paying insurance, taxes and other expenses on the leased property for the remainder of the lease term. Our inability to terminate a lease when we stop fully utilizing a facility or exit a market can have a significant adverse impact on our financial condition, operating results and cash flows.
In addition, at the end of the lease term and any renewal period for a facility, we may be unable to renew the lease without substantial additional cost, if at all. If we are unable to renew our facility leases, we may close or relocate a facility, which could subject us to construction and other costs and risks, which in turn could have a material adverse effect on our business and operating results. Further, we may not be able to secure a replacement facility in a location that is as commercially viable, including access to rail service. Having to close a facility, even briefly to relocate, could reduce the sales that such facility would have contributed to our revenues.
The estimates and judgments we make, or the assumptions on which we rely, in preparing our consolidated financial statements could prove inaccurate.
The preparation of our consolidated financial statements in accordance with GAAP requires us to make estimates and judgments that affect the reported amounts of our assets, liabilities, revenues and expenses, the amounts of charges accrued by us and related disclosures of contingent assets and liabilities. We base our estimates on historical experience and on various other assumptions that we believe to be reasonable under the circumstances. We cannot assure, however, that our estimates, or the assumptions underlying them, will not change over time or otherwise prove inaccurate. Any potential litigation related to the estimates and judgments we make, or the assumptions on which we rely, in preparing our consolidated financial statements could have a material adverse effect on our financial results, harm our business, and cause our share price to decline.
If we need additional capital to fund our operations, we may not be able to obtain sufficient capital and may be forced to limit the scope of our operations.
In connection with our growth strategies, an economic downturn, decline in the performance of our business, or other adverse circumstances, we may experience increased capital needs and accordingly, we may not have sufficient capital to fund our future operations without additional capital investments. There can be no assurance that additional capital will be available to us, including as a result of our relationship with the cannabis industry. If we cannot obtain sufficient capital to fund our operations, we may be forced to limit the scope of our expansion.
We are subject to collection risk that can impact the results of our operations.
We extend credit to customers in the ordinary course of our business in the form of accounts receivable and promissory notes. We seek to ensure our customers are creditworthy before extending credit, but we cannot guarantee that we will receive repayment in full. The industries we serve are also newer and more fragmented, and some of our counter parties are smaller and/or newer businesses and therefore may be higher credit risk. In addition, we may seek to strategically deploy capital in new markets, or with new business partners. Such new markets or partners may present higher risk.
The ongoing conflict between Russia and Ukraine could create or exacerbate certain risks we face to our business, financial condition and results of operations.
The ongoing conflict between Russia and Ukraine could create or exacerbate certain risks we face to our business, financial condition and results of operations. Russia’s invasion of Ukraine and the global response, including the imposition of financial and economic sanctions by the United States and other countries, has created supply constraints and driven inflation that could impact our operations and could create or exacerbate other risks facing our business.
A significant interruption in the operation of our or our suppliers’ facilities could impact our capacity to produce products and service our customers, which could adversely affect revenues and earnings.
Operations at our suppliers’ facilities are subject to disruption for a variety of reasons, including fire, flooding or other natural disasters, disease outbreaks or pandemics, acts of war, terrorism, government shut-downs and work stoppages. Some of our key suppliers experienced significant demand and increased volume in recent years. A significant interruption in the operation of our suppliers’ facilities, especially for those products manufactured at a limited number of facilities, such as our proprietary brand products, could significantly impact our capacity to sell products and service our customers in a timely manner, which could have a material adverse effect on our customer relationships, revenues, earnings and financial position.
The manufacture of some of our products is complex and requires precise, high-quality manufacturing that is difficult to achieve. We have in the past, and may in the future, experience difficulties in manufacturing our products on a timely, cost-effective basis and in sufficient quantities. Our failure to achieve and maintain the required high manufacturing standards could result in further delays or failures in product testing or delivery, cost overruns, product recalls or withdrawals, increased warranty costs or other problems that could harm our business and prospects.
In determining the required quantities of our products and the manufacturing schedule, we must make significant judgments and estimates based on historical experience, inventory levels, current market trends and other related factors. Because of the inherent nature of estimates, there could be significant differences between our estimates and the actual amounts of products we require, which could harm our business and results of operations.
Disruptions in availability or prices of materials sourced by suppliers could adversely affect our results of operations.
We and our suppliers source certain of our products and/or components thereof from outside of the U.S. The general availability and price of those components can be affected by numerous forces beyond our control, including political instability, trade restrictions and other government regulations, duties and tariffs, price controls, changes in currency exchange rates and weather.
A significant disruption in the availability of any of our key products or components thereof could negatively impact our business. In addition, increases in the prices of key commodities and other materials could adversely affect our ability to manage our cost structure. Market conditions may limit our ability to raise selling prices to offset increases in product or raw material costs. For certain products, new sources of supply may have to be qualified under regulatory standards, which can require additional investment and delay bringing a product to market.
Our products may be purchased for use in new and emerging industries or segments subject to varying, inconsistent, and rapidly changing laws, regulations, administrative practices, enforcement approaches, judicial interpretations, and consumer perceptions.
We sell products that end users may purchase for use in new and emerging industries or segments, including the growing of cannabis, that are subject to varying, inconsistent, and rapidly changing laws, regulations, administrative practices, enforcement approaches, judicial interpretations, and consumer perceptions. For example, certain countries and 37 U.S. states have adopted frameworks that authorize, regulate, and tax the cultivation, processing, sale, and use of cannabis for medicinal and/or non-medicinal use, while the U.S. Controlled Substances Act and the laws of other U.S. states prohibit growing cannabis.
Our hydroponic gardening products are multi-purpose products designed and intended for growing a wide range of plants and are generally purchased from retailers by end users who may grow any variety of plants, including cannabis. Although the demand for our products may be negatively impacted depending on how laws, regulations, administrative practices, enforcement approaches, judicial interpretations, and consumer perceptions develop, we cannot reasonably predict the nature of such developments or the effect, if any, that such developments could have on our business.
Damage to our reputation could have an adverse effect on our business.
Maintaining our strong reputation is a key component in our success. Product recalls, disputes and litigation, unauthorized employee statements on social media, our inability to ship, sell or transport our products and other matters may harm our reputation and acceptance of our products, which may materially and adversely affect our business operations, decrease sales and increase costs.
In addition, perceptions that the products we distribute and market are not safe could adversely affect us and contribute to the risk we will be subjected to legal action. We distribute and market a variety of products, such as nutrients and growing media. On occasion, allegations or news reports may be made that some of these products have failed to perform up to expectations or have caused damage or injury to individuals or property. In addition, our products or their use by our customers may be alleged to be damaging to the environment. Public perception that the products we distribute or market harm human health or the environment could impair our reputation, involve us in litigation, damage our brand names and have a material adverse effect on our business.
Unanticipated changes in our tax provisions, the adoption of new tax legislation or exposure to additional tax liabilities could affect our profitability and cash flows.
We are subject to income and other taxes in the U.S. federal jurisdiction and various local, state and foreign jurisdictions. Our effective tax rate in the future could be adversely affected by changes to our operating structure, changes in the mix of earnings in countries with differing statutory tax rates, changes in the valuation of deferred tax assets (such as net operating losses and tax credits) and liabilities, changes in tax laws and the discovery of new information in the course of our tax return preparation process. In particular, the carrying value of deferred tax assets, which are predominantly related to our operations in the U.S., is dependent on our ability to generate future taxable income of the appropriate character in the relevant jurisdiction.
From time to time, tax proposals are introduced or considered by the U.S. Congress or the legislative bodies in local, state and foreign jurisdictions that could also affect our tax rate, the carrying value of our deferred tax assets, or our tax liabilities. Our tax liabilities are also affected by the amounts we charge for inventory, services, licenses and funding. We are subject to ongoing tax audits in various jurisdictions. In connection with these audits (or future audits), tax authorities may disagree with our determinations and assess additional taxes. We regularly assess the likely outcomes of our audits in order to determine the appropriateness of our tax provision. As a result, the ultimate resolution of our tax audits, changes in tax laws or tax rates, and the ability to utilize our deferred tax assets could materially affect our tax provision, net income and cash flows in future periods.
Climate change and other environmental, social and governance issues could adversely affect our brands, business, results of operations and financial condition.
Climate change continues to receive increasing global attention. The possible effects of climate change could include changes in rainfall patterns, changing temperature levels and changes in legislation, regulation and international accords. These changes could over time affect, for example, the availability and cost of raw materials, commodities and energy, which in turn may impact our ability to procure goods or services required for the operation of our business at the quantities and levels we require. Consumers also may change their behavior as a result of the impact of climate change, governmental regulations and public perceptions. Additionally, climate change may present physical risks to our operations, such as damage to facilities, which could disrupt our operations or those of our customers or suppliers.
There has also been increasing focus by investors, regulators and other constituencies on environmental, social and governance (“ESG”) matters. As a result, we may face demands or requirements to make disclosure or commitments or take other action with respect to ESG issues. Our results of operations and financial condition may be adversely impacted if we are unable to effectively manage the risks or costs to us, our brands and our supply chain associated with ESG matters.
RISKS RELATING TO THE CANNABIS INDUSTRY
We are subject to a number of risks associated with the cannabis industry because cannabis is illegal under federal law.
Under the Controlled Substances Act of 1970 (the “CSA”), the federal government lists cannabis as a Schedule I controlled substance (i.e., deemed to have no medical value), and accordingly the manufacturing (cultivation), sale, or possession of cannabis is federally illegal. The U.S. Supreme Court has ruled in 2001 that the federal government has the right to regulate and criminalize cannabis, even for medical purposes. The illegality of cannabis under federal law preempts state laws that legalize its use. Therefore, strict enforcement of federal law regarding cannabis would likely adversely affect our revenues and results of operations.
Federal courts have denied bankruptcies for cannabis businesses upon the bases that businesses cannot violate federal law and then claim the benefits of federal bankruptcy for the same activity and that courts cannot ask a bankruptcy trustee to take possession of and distribute cannabis assets, as such action would violate the CSA. Therefore, we may have difficulties collecting outstanding payments if any of our customers in the cannabis industry declare bankruptcy.
In addition, insurance that is otherwise readily available, such as general liability and directors and officer’s insurance, may be more difficult or impossible to find, and more expensive.
Participants in the cannabis industry have difficulty accessing the service of banks, which makes it difficult for us to operate.
Despite rules issued by the U.S. Department of the Treasury mitigating the risk to banks that do business with cannabis companies permitted under state law, as well as guidance from the U.S. Department of Justice, banks remain wary to accept funds from businesses in the cannabis industry or serving the cannabis industry, such as ours. So far we have been able to find certain banking institutions willing to provide banking services to us; however, there can be no assurance that we will be able to maintain these banking relationships since the production, sale and use of cannabis remains illegal under federal law. An inability to open and maintain bank accounts may make it difficult for us and our customers to do business.
In addition, we have a high volume of cash transactions, which exposes us to associated risks of holding large sums of cash, such as theft and embezzlement, as well as potential seizures of cash by federal authorities if they determine such cash is tied to activities that are illegal under federal law.
If cannabis were to become legal under federal law, its sale and use could become regulated by the Food and Drug Administration ("FDA") or another federal agency, which could result in a decrease in cannabis sales and have a material adverse impact on the demand for our products.
We sell our products through third-party retailers and resellers which do not exclusively sell to the cannabis industry. Some of our products are sold to cannabis industry participants and used in connection with cannabis businesses that are subject to federal and state controlled substance laws and regulations. If cannabis were to become legal under federal law, its sale and use could become regulated by the FDA or another federal agency and extensive regulations may be imposed on the sale or use of cannabis. Such regulations could result in a decrease in cannabis sales and have a material adverse impact on the demand for our products. If we or our customers who are participants in the cannabis industry are unable to comply with any applicable regulations and/or registration prescribed by the FDA, we may be unable to continue to transact with retailers and resellers who sell products to cannabis businesses and/or our financial condition may be adversely impacted.
In addition, federal legalization, or legalization in foreign countries such as Mexico, may significantly increase competition and consolidation in our and our customers’ markets. If we do not manage to successfully compete in such an environment, our revenues and results of operations will be adversely affected.
RISKS RELATING TO OUR COMMON STOCK
There are risks, including stock market volatility, inherent in owning our common stock.
The market price and volume of our common stock have been, and may continue to be, subject to significant fluctuations. These fluctuations may arise from general stock market conditions, the impact of risk factors described herein on our results of operations and financial position, or a change in opinion in the market regarding our business prospects or other factors, many of which may be outside our immediate control.
In addition, COVID-19 and related government responses to address the COVID-19 pandemic may cause sudden and extreme changes in our stock price. Since COVID-19 was first reported, the volatility of U.S. equity markets increased to historic levels. This may cause extreme fluctuations in the market price of our stock. We cannot predict if and when these fluctuations will decrease or increase. In addition to general market conditions, the market price of our stock may become volatile or decline due to actual or anticipated impact of COVID-19 on our financial condition and results of operations.
We may incur indebtedness that ranks senior or equally to our common stock as to liquidation preference and other rights and which may dilute our stockholders’ ownership interest.
Shares of our common stock are common equity interests in us and, as such, will rank junior to all of our existing and future indebtedness and other liabilities. In addition, any additional capital raised through the sale of equity or equity-backed securities may dilute our stockholders’ ownership percentages and could also result in a decrease in the market value of our common stock.
Our security holders may be diluted by future issuances of securities by us. The market price of our common stock could be negatively affected by future sales of our common stock.
In the future, we may issue our authorized but previously unissued equity securities, including additional shares of capital stock or securities convertible into or exchangeable for our capital stock. Such issuance of additional securities would dilute the ownership stake in us held by our existing stockholders and could adversely affect the value of our securities.
As of the date hereof, we had outstanding warrants to purchase an aggregate of 33 thousand shares of our common stock at a weighted average exercise price of $15.82 per share, and options to purchase an aggregate of 604 thousand shares of our common stock (all of which are vested as of this date) at a weighted average exercise prices of $3.97 per share. The exercise of such outstanding options and warrants will result in substantial dilution of our security holders. In the future, we may also issue additional shares of our common stock, warrants or other securities that are convertible into or exercisable for the purchase of shares of our common stock in connection with hiring and/or retaining employees or consultants, future acquisitions, future sales of our securities for capital raising purposes, or for other business purposes. The future issuance of any such additional shares of our common stock or other securities, for any reason including those stated above, may have a negative impact on the market price of our common stock. There can be no assurance that the issuance of any additional shares of common stock, warrants or other convertible securities may not be at a price (or exercise prices) below the price of the common stock offered hereby.
If our existing stockholders, our directors, their affiliates, or our executive officers, sell a substantial number of shares of our common stock in the public market, the market price of our common stock could decrease significantly. The perception in the public market that these stockholders might sell our common stock could also depress the market price of our common stock and could impair our future ability to obtain capital, especially through an offering of equity securities.
If securities or industry analysts do not publish research or reports about our business, or they publish negative reports about our business, our share price and trading volume could decline.
The trading market for our common stock will depend in part on the research and reports that securities or industry analysts publish about us or our business, our market and our competitors. We do not have any control over these analysts. If one or more of the analysts who cover us downgrade our shares or change their opinion of our shares, our share price would likely decline. If one or more of these analysts cease coverage of our company or fail to regularly publish reports on us, we could lose visibility in the financial markets, which could cause our share price or trading volume to decline.
ITEM 1B. UNRESOLVED STAFF COMMENTS
None.
ITEM 2. PROPERTIES
REAL ESTATE
Our real estate portfolio consists primarily of leased retail stores, distribution centers, and offices. Our principal offices are located at 5619 DTC Parkway, Suite 900, Greenwood Village, CO 80111. In total the Company currently leases approximately 946,000 square feet of space, which consists primarily of 11,500 feet of corporate office space, 159,000 square feet of warehouse space and 775,500 square feet of store space.
| | | | | | | | | | | | | | | | | |
| Number of Locations | | Square feet | | Lease Expiration Dates |
| Arizona | 1 | | 20,000 | | May 2031 |
| California | 22 | | 4,000-60,000 | | Aug 2023 to June 2032 |
| Colorado | 6 | | 3,000 - 22,800 | | December 2023 to July 2025 |
| Florida | 1 | | 40,000 | | June 2031 |
| Massachusetts | 1 | | 14,500.00 | | | April 2027 |
| Maine | 5 | | 3,000-21,000 | | Jan 2023 to April 2031 |
| Michigan | 6 | | 5,300-22,000 | | Jan 2023 to Sep 2030 |
| Missouri | 1 | | 5,000 | | Feb 2023 |
| Mississippi | 1 | | 30,000 | | Nov 2026 |
| New Jersey | 1 | | 7,500 | | Aug 2032 |
| New Mexico | 1 | | 3,500 | | December 2023 |
| Oklahoma | 5 | | 10,000-40,700 | | Jan 2024 to February 2026 |
| Oregon | 4 | | 5,000 - 15,000 | | Aug 2024 to Jan 2027 |
| Rhode Island | 1 | | 9,000 | | January 2023 |
| Virginia | 1 | | 9,000 | | Sept 2032 |
| Washington | 3 | | 2,000-24,000 | | Jan 2025 – Aug 2031 |
ITEM 3. LEGAL PROCEEDINGS
We are involved in lawsuits and claims which arise in the normal course of our business, including the initiation and defense of proceedings related to contract and employment disputes. In our opinion, these claims individually and in the aggregate are not expected to have a material adverse effect on our financial condition, results of operations or cash flows.
In December 2021, the Company was sued in the U.S. District Court for the Southern District of Texas related to a Promissory Note & Asset Acquisition Rights Option (“Note & Option”) with TGC Systems, LLC (“Total Grow”). The Texas case has been dismissed and the parties are currently engaged in arbitration pursuant to the arbitration clause of the Note & Option. Among other claims, Total Grow alleges that the Company is liable to Total Grow based on promissory estoppel and breach of contract for failing to consummate the acquisition of Total Grow by the Company. The Company believes that the claims against it are without merit and is vigorously defending against them. The Company is also counterclaiming for repayment of $1,500,000 principal plus interest loaned by the Company to Total Grow pursuant to the Note & Option. The Company has accrued a reserve of $1.3 million against the Note & Option.
There can be no assurance that future developments related to pending claims or claims filed in the future, whether as a result of adverse outcomes or as a result of significant defense costs, will not have a material effect on the Company’s financial condition, results of operations or cash flows. We believe that our assessment of contingencies is reasonable and
that the related accruals, in the aggregate, are adequate; however, there can be no assurance that the final resolution of these matters will not have a material effect on our financial condition, results of operations or cash flows.
ITEM 4. MINE SAFETY DISCLOSURES
Not applicable.
PART II
ITEM 5. MARKET FOR REGISTRANT’S COMMON EQUITY, RELATED STOCKHOLDER MATTERS AND ISSUER PURCHASES OF EQUITY SECURITIES
MARKET INFORMATION
The Company commenced trading on the Nasdaq Capital Market on December 2, 2019 under the symbol “GRWG”. Prior to that date, our stock traded on the OTCQX Best Market since October 10, 2017, prior to which it was traded on the OTCQB Market since November 11, 2016.
COMPARISON OF 5-YEAR CUMULATIVE RETURN
The following graph compares the yearly change in the cumulative total stockholder return of our common stock for the past five fiscal years with the cumulative return of the Russell 2000 Index, the S&P 500 Index, and the S&P Retail Select Industry Index.
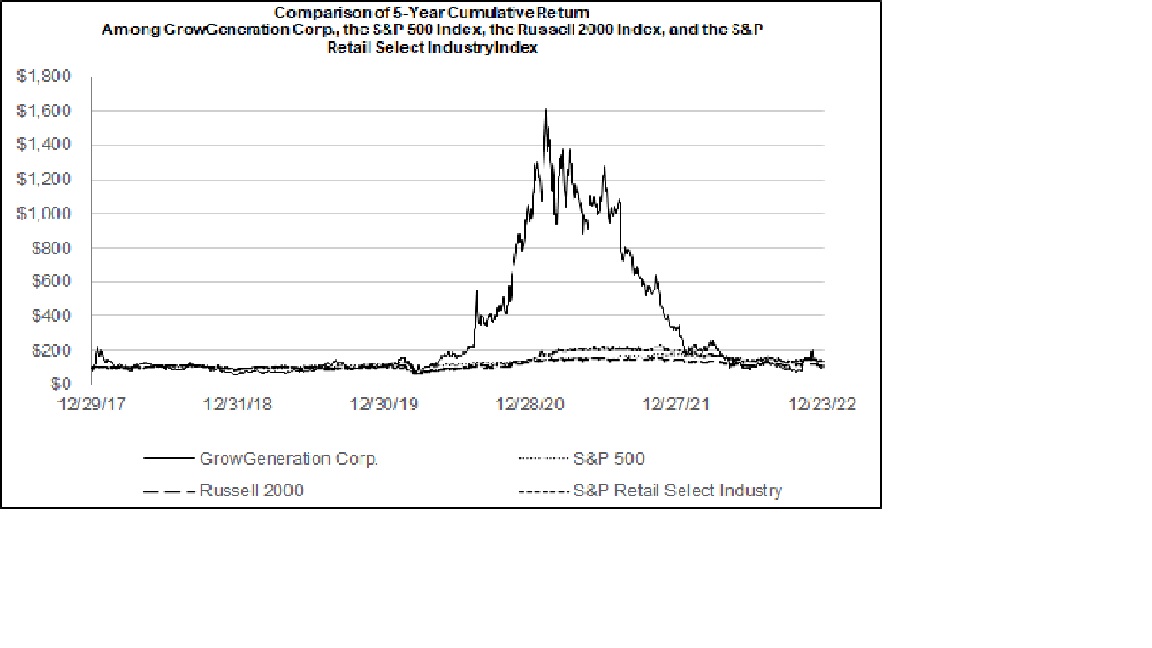 HOLDERS
The approximate number of stockholders of record as of February 27, 2023 was 84. The number of stockholders of record does not include beneficial owners of our common stock whose shares are held in the names of various dealers, clearing agencies, banks, brokers and other fiduciaries.
DIVIDENDS
We have never paid any cash dividends on our common stock. We anticipate that we will retain funds and future earnings to support operations and to finance the growth and development of our business. Therefore, we do not expect to pay cash dividends in the foreseeable future. Any future determination to pay dividends will be at the discretion of our board of directors and will depend on our financial condition, results of operations, capital requirements and other factors that our board of directors deems relevant. In addition, the terms of any future debt or credit financings may preclude us from paying dividends.
RECENT SALES OF UNREGISTERED SECURITIES
Stock Options and Stock Awards
The Company has a 2014 Equity Compensation Plan (the “2014 Plan”) and an Amended and Restated 2018 Equity Compensation Plan (the “2018 Plan”). On February 7, 2020, the Board approved the amendment and restatement of the 2018 Plan to increase the number of shares issuable thereunder from 2,500,000 to 5,000,000, which amendment was approved by shareholders on May 11, 2020.
From inception to December 31, 2022, we granted stock options under our 2014 Plan to purchase an aggregate of 2,113,833 shares at exercise prices ranging from $0.60 to $5.11 per share. Of the total options granted as of December 31, 2022, 2,108,833 have been exercised and 5,000 have been forfeited, resulting in zero options outstanding. In addition, as of December 31, 2022, 382,351 stock awards have been issued under our 2014 Plan.
From inception to December 31, 2022, we have granted stock options under our 2018 Plan to purchase an aggregate of 1,888,500 shares at exercise prices ranging from $2.25 to $17.39 per share. As of December 31, 2021, 998,911 options have been exercised and 285,094 shares forfeited under the 2018 Plan. In addition, as of December 31, 2022, 1,765,281 stock awards have been issued under our 2018 Plan.
Shares of Common Stock Issued In Connection with Asset Purchases
Refer to issuances of shares of common stock in connection with acquisitions during 2020, 2021 and 2022 disclosed under “ITEM 1. BUSINESS – Acquisitions”. These shares were issued in reliance on the exemption under Section 4(a)(2) of the Securities Act.
ITEM 6. [RESERVED]
ITEM 7. MANAGEMENT’S DISCUSSION AND ANALYSIS OF FINANCIAL CONDITION AND RESULTS OF OPERATION
The following discussion and analysis of our financial condition and results of operations should be read together with our consolidated financial statements and the related notes and the other information included elsewhere in this report. This discussion contains forward-looking statements that involve risks and uncertainties and are not guarantees of future performance. Our actual results could differ materially from those anticipated in these forward-looking statements as a result of various factors, including those discussed below and elsewhere in this report, particularly those under “Risk Factors.” Dollars in tabular format are presented in thousands, except per share data, or otherwise indicated.
OVERVIEW
GrowGeneration Corp. (together with all of its direct and indirect wholly owned subsidiaries, collectively “GrowGeneration” or the “Company”), incorporated in Colorado in 2014, is the largest chain of specialty retail hydroponic and organic garden centers in the U.S. and is a leading marketer and distributor of products for both indoor and outdoor hydroponic and organic gardening. The Company also engages in the distribution of private label products and commercial benching. Currently, GrowGeneration has 60 retail locations across 16 states in the U.S. We also operate an online superstore for cultivators at growgeneration.com, as well as a wholesale business for resellers, HRG Distribution. Our business is driven by a wide selection of products, facility design services, solutions driven staff and pick, pack and ship distribution and fulfillment capabilities. GrowGeneration carries and sells thousands of products, including nutrients, growing media, lighting, environmental control systems, vertical benching and accessories for hydroponic gardening, as well as other indoor and outdoor growing products, that can be used for growing a wide range of plants. Our products include proprietary brands such as Charcoir, Drip Hydro, Power Si, MMI benching and racking, and more. GrowGeneration also provides facility design services to commercial growers. We employ approximately 455 employees, a majority of them we have branded as “Grow Pros”. Currently, our operations span over 946,000 square feet of retail and warehouse space.
MARKETS AND BUSINESS SEGMENTS
Our target customer segments include commercial and craft growers in the plant-based medicine market, as well as vertical and urban farmers who grow organic herbs, fruits and vegetables. Unlike the traditional agricultural industry, these cultivators use innovative indoor and outdoor growing techniques to produce specialty crops in highly controlled environments. This enables them to produce crops at higher yields and quality, regardless of the season or weather conditions. Our commercial benching business customers also include retailers and other businesses.
The Company has three primary reportable segments, including retail operations, e-commerce, and distribution and other. The Company has segmented its operations to reflect the manner in which management reviews and evaluates the results of
its operations. The structure reflects the manner in which the chief operating decision maker regularly assesses information for decision-making purposes, including the allocation of resources.
We operate our business through the following business segments:
•Retail: The core of our business strategy is to operate the largest chain of retail garden centers in the U.S. The hydroponic retail landscape is fragmented, which allows us to acquire “best of breed” hydroponic retail operations and leverage efficiencies of a centralized organization. During 2022, the Company acquired or opened 5 new locations and expanded its physical retail presence into 4 new states. Our plan is to continue to acquire, open and operate garden centers and related businesses throughout the U.S. However, in light of persistent difficult market conditions, the Company also closed 8 underperforming retail locations in 2022 and may consider additional store consolidation in 2023. Some of our garden centers have multi-functions, with added capabilities that include warehousing, distribution and fulfillment for our online platforms and direct fulfillment to our commercial customers.
Our retail segment also includes our commercial sales organization, which is focused on selling products and services, including end-to-end solutions, for large commercial cultivators outside of the physical retail network. When a commercial customers gain new cultivation licenses, they need lighting, benching, environmental control systems, irrigation, fertigation and other products to outfit their facilities. Existing facilities also need consumable products for operations, as well as equipment updates from time to time. Commercial customers typically purchase large dollar amounts and sizes of products. We offer commercial customers volume pricing, terms and financing.
•E-Commerce: Our digital strategy is primarily focused on capturing the home, craft and commercial grower online. GrowGeneration.com offers thousands of hydroponic products, all curated by our product team. GrowGeneration.com offers customers the option to have their orders shipped directly to their locations, anywhere in North America. GrowGeneration also sells its products through its distribution website, HRGdist.com, and online marketplaces such as Amazon and Walmart.
•Distribution and other: In December 2020, GrowGeneration purchased the business of Canopy Crop Management Corp., the developer of the popular PowerSi line of monosilicic acid products, a widely used nutrient additive for plants. In March 2021, the Company purchased Charcoir, a line of premium coco pots, cubes and medium. In December 2021, the Company purchased the assets of Mobile Media, Inc. ("MMI"), a mobile shelving and storage solutions developer and manufacturer. In February 2022, the Company purchased the assets of Horticultural Rep Group, Inc. ("HRG"), a specialty marketing and sales organization of horticultural products. The Company is in the process of combining the operations and management of these non-retail enterprises. The products these companies provide are integrated into our retail, e-commerce, and direct sales activities and we receive incremental revenue from the sale of these products.
We recognize specifically identifiable operating costs such as cost of sales, distribution expenses, selling and general administrative expenses within each segment. Certain general and administrative expenses, such as administrative and management expenses, salaries and benefits, share based compensation, director fees, legal expenses, accounting and consulting expenses and technology costs, are not allocated to the specific segments and are reflected in the enterprise results.
GROWTH STRATEGIES
Core to our growth strategy is to expand the number of our retail garden centers in the U.S., especially in markets where we do not already have a physical presence, or where our existing physical presence is limited. During 2022, the Company acquired or opened 5 new locations and expanded its physical retail presence into 4 new states. Our plan is to continue to acquire, open and operate garden centers. However, in light of difficult market conditions that persisted throughout the year, the Company also closed 8 underperforming retail locations in 2022 and may consider additional store consolidation in 2023.
GrowGeneration will also pursue growth through expansion of its commercial sales and distribution capabilities to sell more product to commercial cultivators for large grow operations and independent retail garden centers for resale, as well as by promoting and expanding its portfolio of proprietary brands to increase its market share, product offerings and profitability.
RESULTS OF OPERATIONS
Sales
Net sales for the year ended December 31, 2022 were approximately $278.2 million, a decrease of 34.2% over the year ended December 31, 2021, which was approximately $422.5 million. 2021 net revenue increased approximately 118.5% over the year ended December 31, 2020, which was approximately $193.4 million.
The decrease in net revenues for the year ended December 31, 2022 compared to the year ended December 31, 2021 is due to a decrease of approximately $178.0 million in same store sales, which represented a 51.6% decrease year-over-year, which is primarily attributable to the downturn in the business cycle for cannabis cultivators, resulting in less supply and equipment purchasing. Overall sales in our retail segment declined from $369.2 million to $205.5 million and overall sales in our e-commerce segment declined from $36.2 million to $15.1 million year over year. These declines were partially offset by an increase in sales from our distribution and other segment from $17.1 million for the year ended December 31, 2021 compared to $57.6 million for the year ended December 31, 2022 due to the acquisitions of HRG and MMI.
The increase in 2021 revenues over 2020 is due to an increase in same store sales of approximately $40.1 million, which represented 24.4% growth year-over-year. Distributed sales in 2021 were $17.1 million from acquisitions of Power Si and Charcoir. E-commerce sales increased from $10.6 million in 2020 to $36.2 million in 2021 primarily attributable to $11.2 million growth in owned e-commerce sites and $14.4 million from the Agron acquisition.
Cost of Sales
Cost of sales for the year ended December 31, 2022 decreased approximately $96.3 million or 31.7% compared to the year ended December 31, 2021. The decrease in cost of sales is primarily due to the 34.2% decrease in sales.
Cost of sales for the year ended December 31, 2021 increased approximately $161.9 million or 113.8% compared to the year ended December 31, 2020. The increase in cost of sales was directly attributable to the 118.5% increase in revenues, as detailed above, comparing the year ended December 31, 2021 to 2020.
Gross profit was approximately $70.3 million for the year ended December 31, 2022, compared to approximately $118.2 million for the December 31, 2021, a decrease of approximately $48.0 million or 40.6%. The decrease in gross profit is primarily related to the 34.2% decrease in revenues. Gross profit as a percentage of revenues was 25.3% for the year ended December 31, 2022, compared to 28.0% for 2021. The decrease in the gross profit margin percentage is primarily due to increased freight costs as well as higher levels of product discounting in the retail segment.
Gross profit for the year ended December 31, 2021 increased approximately $67.2 million or 131.6% compared to the year ended December 31, 2020. Gross profit as a percentage of sales was 28.0% for the year ended December 31, 2021, compared to 26.4% for the year ended December 31, 2020.
Operating Expenses
Operating expenses are comprised of store operations, selling, general, and administrative, and depreciation and amortization. Operating costs were approximately $238.1 million for the year ended December 31, 2022 and approximately $103.2 million for the year ended December 31, 2021, an increase of approximately $134.9 million or 130.7%. The increase in operating expenses is primarily attributable to the impairment loss of $127.8 million recorded during 2022, which was primarily attributable to the decline in the Company's market capitalization below net assets in addition to the Company's declining performance.
Operating expenses for the year ended December 31, 2021 increased approximately $60.6 million or 142.3% compared to the year ended December 31, 2020.
Store operating costs, primarily payroll, rent and utilities, and allocated corporate overhead costs, were approximately $54.7 million for the year ended December 31, 2022, compared to $49.7 million for the year ended December 31, 2021, an increase of $4.9 million or 9.9%. The increase in store operating costs was directly attributable to the addition of 23 locations that were added during 2021.
During 2021, store operating costs increased approximately $31.0 million or 165.7% compared to the year ended December 31, 2020. The increase in store operating costs was directly attributable to the 118.5% increase in revenues and the addition of 23 locations that were added during 2021. Pre-opening expenses for new stores opened during the period increased approximately $0.9 million during 2021.
Total corporate overhead, which is comprised of Selling, general, and administrative expense and Depreciation and amortization expense, was approximately $55.6 million for the year ended December 31, 2022, compared to $53.5 million for the year ended December 31, 2021, an increase of $2.1 million or 4.0%. Selling, general, and administrative costs were approximately $36.8 million for the year ended December 31, 2022, compared to approximately $39.5 million for the year ended December 31, 2021. Salaries expense decreased to $18.4 million for the year ended December 31, 2022 from $20.0 million for the year ended December 31, 2021. General and administrative expenses increased to $14.5 million from $14.3 million.
During 2021, total corporate overhead was approximately $53.5 million for the year ended December 31, 2021, compared to $23.9 million for the year ended December 31, 2020, an increase of $29.6 million or 124.0%. Selling, general, and administrative costs were approximately $40.9 million for the year ended December 31, 2021, compared to approximately $21.5 million for the year ended December 31, 2020. Salaries expense increased to $20.0 million from $8.6 million primarily due to an increase in corporate staff and general and administrative expenses increased to $14.3 million from $5.0 million to support expanding operations. These increases were partially offset by a decrease in share-based compensation to $6.6 million from $7.9 million primarily due to new executive compensation agreements effective January 1, 2020 that had front loaded vesting provisions for shares and options that were granted January 1, 2020 for which the remaining vesting was over a two-year period.
Impairment loss was approximately $127.8 million for the year ended December 31, 2022 following impairment testing of goodwill and intangible assets performed in the second quarter as a result of the Company’s market capitalization falling below total net assets. In addition, financial performance continued to weaken during the quarter for which testing was performed. Refer to Critical Accounting Policies, Judgments, and Estimates and Note 6, Goodwill and Intangible Assets, of the notes to the consolidated financial statements for additional information.
Net Income (Loss)
Net loss for the year ended December 31, 2022 was approximately $163.7 million, compared to net income of approximately $12.8 million for the year ended December 31, 2021, a decrease of approximately $176.5 million.
Net income for the year ended December 31, 2021 was approximately $12.8 million, compared to net income of approximately $5.3 million for the year ended December 31, 2020, an increase of $7.5 million. Net income for 2021 compared to 2020 was primarily impacted by a 118.5% increase in revenues, offset slightly by increased cost of goods sold of 113.8%. Store operating costs as a percentage of revenue was 11.8% in 2021, compared to 9.7% offsetting the increase in cost of sales.
CONDENSED 2022, 2021, AND 2020 RESULTS OF OPERATIONS (in thousands)
| | | | | | | | | | | | | | | | | | | | |
| For the Year Ended | |
| December 31, | |
| 2022 | | 2021 | | 2020 | |
| Sales, net | $ | 278,166 | | | $ | 422,489 | | | $ | 193,365 | | |
| Cost of Sales | 207,903 | | | 304,248 | | | 142,317 | | |
| Gross profit | 70,263 | | | 118,241 | | | 51,048 | | |
| Operating expenses | 238,138 | | | 103,239 | | | 42,611 | | |
| Income (loss) from operations | (167,875) | | | 15,002 | | | 8,437 | | |
| Other income (expense) | 1,243 | | | 227 | | | 142 | | |
| Pre-tax net income (loss) | (166,632) | | | 15,229 | | | 8,579 | | |
| Income taxes | 2,885 | | | (2,443) | | | (3,251) | | |
| Net income (loss) | $ | (163,747) | | | $ | 12,786 | | | $ | 5,328 | | |
| | | | | | |
Use of Non-GAAP Financial Information
The Company believes that the presentation of results excluding certain items in “Adjusted EBITDA,” such as non-cash equity compensation charges, provides meaningful supplemental information to both management and investors, facilitating the evaluation of performance across reporting periods. The Company uses these non-GAAP measures for internal planning and reporting purposes. These non-GAAP measures are not in accordance with, or an alternative for,
generally accepted accounting principles and may be different from non-GAAP measures used by other companies. The presentation of this additional information is not meant to be considered in isolation or as a substitute for net income or net income per share prepared in accordance with generally accepted accounting principles.
Set forth below is a reconciliation of Adjusted EBITDA to net income (loss) (in thousands except per share data):
| | | | | | | | | | | | | | | | | |
| Year ended December 31, |
| 2022 | | 2021 | | 2020 |
| Net income (loss) | $ | (163,747) | | | $ | 12,786 | | | $ | 5,328 | |
| Income taxes | (2,885) | | | 2,443 | | | 3,251 | |
| Interest income | (580) | | | (486) | | | (44) | |
| Interest expense | 21 | | | 43 | | | 14 | |
| Depreciation and Amortization | 17,132 | | | 12,600 | | | 2,436 | |
| EBITDA | $ | (150,059) | | | $ | 27,386 | | | $ | 10,985 | |
| Impairment loss | 127,831 | | | — | | | — | |
Share based compensation (option compensation, warrant compensation, stock issued for services) | 4,967 | | | 6,585 | | | 7,856 | |
| Fixed asset disposal | 568 | | | 197 | | | — | |
| | | | | |
| Adjusted EBITDA | $ | (16,693) | | | $ | 34,168 | | | $ | 18,841 | |
| | | | | |
| Adjusted EBITDA per share, basic | $ | (0.27) | | | $ | 0.58 | | | $ | 0.43 | |
| Adjusted EBITDA per share, diluted | $ | (0.27) | | | $ | 0.57 | | | $ | 0.41 | |
LIQUIDITY AND CAPITAL RESOURCES
As of December 31, 2022, we had working capital of approximately $134.9 million, compared to working capital of approximately $169.8 million as of December 31, 2021, a decrease of approximately $34.9 million. The decrease in working capital from December 31, 2021 to December 31, 2022 was due primarily to a decrease in inventory and prepaid inventory partially offset by a decrease in current liabilities. As of December 31, 2022, we had cash and cash equivalents of $40.1 million. Currently, we have no extraordinary demands, commitments or uncertainties that would reduce our current working capital. Our core strategy continues to focus on expanding our geographic reach across the United States and building our store and brand portfolio through organic growth and acquisitions. We believe that some of our acquisitions and new store openings can come from cash flow from operations.
As of December 31, 2021, we had working capital of approximately $169.8 million, compared to working capital of approximately $229.0 million as of December 31, 2020, a decrease of approximately $53.1 million. The decrease in working capital from December 31, 2020 to December 31, 2021 was due primarily to business acquisitions completed during the year ended December 31, 2021 for which the cash consideration was approximately $80.8 million. This decrease in working capital related to business acquisitions was partially offset by an increase in inventory associated with more locations and our ability to leverage greater bulk purchasing due to our growth. At December 31, 2021, we had cash and cash equivalents of approximately $41.4 million and available for sale debt securities of $39.8 million.
We currently do not anticipate any immediate need for additional financing. Management believes that the Company is currently adequately funded to support current and and future operations. We will evaluate the need for additional financing in the future to continue to grow our business, including through acquisitions. To date we have financed our operations through the sale of newly issued common stock, warrants and convertible debentures as discussed below.
Operating Activities
Net cash provided by operating activities for year ended December 31, 2022 was approximately $11.9 million, compared to $5.2 million for the year ended December 31, 2021. The Company reduced prepaid inventory by $10.3 million in the
current year as well as inventory by $32.9 million, partially offset by payments for accounts payable, accrued payroll, and a reduction in customer deposits.
Net cash provided by operating activities for year ended December 31, 2021 was approximately $5.2 million, compared to net cash used of $213 thousand for the year ended December 31, 2020. Cash used in operations as a result of an inventory increase was primarily attributable to our additional store count. In addition, we used our capital capabilities to secure production of product overseas through prepaid inventory purchase commitments with long lead times in advance of spring 2022 needs. Cash used in accounts and notes receivable decreases were primarily driven by increased revenues partially offset by the collection of notes receivable. Cash provided by the increase in accounts payable and accrued liabilities and customer deposits are attributable to our increased store count and related increase in cost of sales. The increase in payroll liability is primarily driven by increased headcount related to our increased operations.
Investing Activities
Net cash provided by investing activities was approximately $11.6 million for the year ended December 31, 2022 compared to cash used of approximately $139.3 million for the year ended December 31, 2021. Investing activities in 2022 were primarily attributable to acquisitions of $7.2 million, purchase of marketable securities of $38.7 million, and purchase of vehicles and store equipment of $12.9 million, partially offset by $46.6 million of marketable security maturities. Investing activities for the year ended December 31, 2021 were primarily related to store acquisitions of $80.8 million and the purchase of vehicles and store equipment of $18.7 million.
Net cash used in investing activities was approximately $139.3 million for the year ended December 31, 2021 and approximately $45.8 million for the year ended December 31, 2020. Investing activities in 2021 were primarily attributable to acquisitions of $80.8 million, purchase of marketable securities of $75.0 million, and purchase of vehicles and store equipment of $18.7 million, partially offset by $35.2 million of marketable security maturities. Investing activities for the year ended December 31, 2020 were primarily related to store acquisitions of $41.4 million and the purchase of vehicles and store equipment of $3.4 million.
Financing Activities
Net cash used in financing activities for the year ended December 31, 2022 was approximately $1.7 million and was primarily attributable to stock withheld to cover payroll taxes. Net cash provided by financing activities for the year ended December 31, 2021 was $2.4 million and was primarily attributable to stock redemptions partially offset by the proceeds from the sale of common stock and exercise of warrants and options. Net cash provided by financing activities for the year ended December 31, 2020 was $211.0 million and was primarily from proceeds from the sale of common stock and exercise of warrants and options.
2020 Offerings
On December 11, 2020, the Company consummated an underwritten public offering of 5,750,000 shares of its common stock, which included the exercise in full of the underwriters’ option to purchase an additional 750,000 shares of common stock to cover over-allotments. The shares were sold at a public offering price of $30 per share, generating gross proceeds of $172.5 million, before deducting the underwriting discounts and commissions and other offering expenses. Net proceeds from the sales of common stock, net of all offering costs and expenses, was approximately $162.5 million.
On July 2, 2020, the Company consummated an underwritten public offering of 8,625,000 shares of its common stock, which included the exercise in full of the underwriters’ option to purchase an additional 1,125,000 shares of common stock to cover over-allotments. The shares were sold at a public offering price of $5.60 per share, generating gross proceeds of $48.3 million, before deducting the underwriting discounts and commissions and other offering expenses. Net proceeds from the sales of common stock, net of all offering costs and expenses, was approximately $44.6 million.
Critical Accounting Policies and Estimates
The preparation of financial statements in conformity with U.S. generally accepted accounting principles requires management to make estimates and judgments that affect the reported amounts of assets, liabilities, and expense and related disclosures. On an ongoing basis, management bases and evaluates estimates on historical experience and on various other market-specific and other relevant assumptions believed to be reasonable under the circumstances, the results of which form the basis for making judgments about the carrying values of assets and liabilities that are not readily apparent from other sources. Actual results may differ significantly from those estimates.
We believe the following critical policies reflect the more significant judgments and estimates used in preparation of the consolidated financial statements.
Impairment of Goodwill and Intangible Assets
Goodwill reflects the cost of an acquisition in excess of the fair values assigned to identifiable net assets acquired. The Company assesses goodwill for impairment during the fourth fiscal quarter or more frequently if events or changes in circumstances indicate the asset might be impaired. The Company performs impairment assessment for its reporting units using a fair value method based on management's judgements and assumptions or third-party valuations. During the second quarter of 2022, the Company concluded it had a triggering event.
For goodwill impairment testing purposes, the Company determined four reporting units, three of which were subject to a quantitative assessment. The fair value of a reporting unit refers to the price that would be received to sell the unit as a whole in an orderly transaction between market participants at the measurement date. In estimating the fair value, the Company uses the income approach in which discounted cash flow analyses are used to derive estimates of fair value of each reporting unit. Multiples of earnings based on the average of historical, published multiples of earnings of comparable entities with similar operations and economic characteristics are also used in developing estimated fair values. The inputs utilized in the analyses are classified as Level 3 inputs within the fair value hierarchy as defined in ASC 820, Fair Value Measurement. These calculations contain uncertainties as they require management to make assumptions about market comparables, future cash flows and appropriate discount rates (based on weighted average cost of capital ranging from 13% to 16% at June 30, 2022) to reflect the risk inherent in the future cash flows and to derive a reasonable enterprise value and related premium. The estimated future cash flows reflect management's latest assumptions of the financial projections based on current and anticipated competitive landscape, including estimates of revenue based on production volumes over the foreseeable future and long-term growth rates, and operating margins based on historical trends and future cost containment activities. A change in any of these estimates and assumptions could produce a different fair value, which could have a material impact on the results of the goodwill impairment test and on the Company's results of operations. The estimated fair value is then compared with the carrying amount of the reporting unit, including recorded goodwill. The Company is subject to financial statement risk to the extent that the carrying amount exceeds the estimated fair value. As a result of the tests, the Company recorded an impairment to goodwill during the second quarter of 2022. Refer to Note 6, Goodwill and Intangible Assets, of the notes to the consolidated financial statements for additional information.
The Company assesses intangible assets with definite lives for impairment whenever events or changes in circumstances indicate that the asset's carrying amount may not be recoverable. In performing our assessment for recoverability of amortizable intangible assets, the Company estimates the future undiscounted cash flows expected to result from the use of the asset and its eventual disposition. If the sum of the expected future undiscounted cash flows from intangible assets is less than the carrying amount of the asset, an impairment loss is recognized. A considerable amount of management judgement and assumptions are required in performing the impairment tests. During the second quarter of 2022, the Company concluded it had a triggering event. The Company’s market capitalization fell below total net assets. In addition, financial performance continued to weaken during the quarter, which is contrary to prior experience. Management reassessed business performance expectations, following persistent adverse developments in equity markets, deterioration in the environment in which the Company operates, inflation, lower than expected sales, and an increase in operating expenses. These indicators, in the aggregate, required impairment testing for finite-lived intangible assets at the asset group level and goodwill at the reporting unit level. These impairments were measured under an income approach utilizing forecasted discounted cash flows to determine fair values of the impaired assets. These methods are consistent with the methods the Company employed in prior periods to value intangible assets. The inputs utilized in the analyses are classified as Level 3 inputs within the fair value hierarchy as defined in ASC 820, Fair Value Measurement, and primarily consist of expected future operating margins and cash flows, weighted average cost of capital rates, estimated salable values and third-party appraisal techniques such as market comparables. To the extent that profitability declines as compared to forecasted profitability or if adverse changes occur to key assumptions or other fair value measurement inputs, further impairment of long-lived assets could occur in the future. Refer to Note 6, Goodwill and Intangible Assets, of the notes to the consolidated financial statements for additional information.
Other Significant Accounting Policies
Other significant accounting policies, primarily those with lower levels of uncertainty than those discussed above, are also critical to understanding the consolidated financial statements. The notes to consolidated financial statements included in this Annual Report on Form 10-K contain additional information related to our accounting policies, including recent accounting pronouncements, and should be read in conjunction with this discussion.
OFF-BALANCE SHEET ARRANGEMENTS
We do not have any off-balance sheet arrangements (as that term is defined in Item 303 of Regulation S-K) that are reasonably likely to have a current or future material effect on our financial condition, revenue or expenses, results of operations, liquidity, capital expenditures or capital resources.
ITEM 7A. QUANTITATIVE AND QUALITATIVE DISCLOSURES ABOUT MARKET RISK
Market risk is the risk of economic losses due to adverse changes in financial market prices and rates.
Interest Rate Risk
We currently have no material exposure to interest rate risk from investments. We currently invest a portion of our excess cash primarily in money market funds, debt instruments of the U.S. government and its agencies, and high quality corporate bonds and commercial paper. Due to the short-term nature of these investments, we do not believe that there will be material exposure to interest rate risk arising from our investments.
As of December 31, 2022, we had less than $0.1 million of interest bearing debt outstanding.
Impact of Inflation
Our results of operations and financial condition are presented based on historical costs. Inflation affects our cost of sales and store operating costs. We maintain strategies to mitigate the impact of higher raw material, energy and commodity costs, which include cost reduction, sourcing, passing along certain cost increases to customers and other actions, which may offset only a portion of the adverse impact.
ITEM 8. FINANCIAL STATEMENTS AND SUPPLEMENTARY DATA
TABLE OF CONTENTS
Report of Independent Registered Public Accounting Firm
Board of Directors and Stockholders
GrowGeneration Corp.
Opinion on the financial statements
We have audited the accompanying consolidated balance sheet of GrowGeneration Corp. (the “Company”) as of December 31, 2022, the related consolidated statements of operations, stockholders’ equity, and cash flows for the year ended December 31, 2022, and the related notes (collectively referred to as the “financial statements”). In our opinion, the financial statements present fairly, in all material respects, the financial position of the Company as of December 31, 2022, and the results of its operations and its cash flows for the year ended December 31, 2022, in conformity with accounting principles generally accepted in the United States of America.
We also have audited, in accordance with the standards of the Public Company Accounting Oversight Board (United States) (“PCAOB”), the Company’s internal control over financial reporting as of December 31, 2022, based on criteria established in the 2013 Internal Control—Integrated Framework issued by the Committee of Sponsoring Organizations of the Treadway Commission (“COSO”), and our report dated March 15, 2023 expressed an adverse opinion.
Basis for opinion
These financial statements are the responsibility of the Company’s management. Our responsibility is to express an opinion on the Company’s financial statements based on our audit. We are a public accounting firm registered with the PCAOB and are required to be independent with respect to the Company in accordance with the U.S. federal securities laws and the applicable rules and regulations of the Securities and Exchange Commission and the PCAOB.
We conducted our audit in accordance with the standards of the PCAOB. Those standards require that we plan and perform the audit to obtain reasonable assurance about whether the financial statements are free of material misstatement, whether due to error or fraud. Our audit included performing procedures to assess the risks of material misstatement of the financial statements, whether due to error or fraud, and performing procedures that respond to those risks. Such procedures included examining, on a test basis, evidence regarding the amounts and disclosures in the financial statements. Our audit also included evaluating the accounting principles used and significant estimates made by management, as well as evaluating the overall presentation of the financial statements. We believe that our audit provide a reasonable basis for our opinion.
Critical audit matter
The critical audit matter communicated below is a matter arising from the current period audit of the financial statements that was communicated or required to be communicated to the audit committee and that: (1) relates to accounts or disclosures that are material to the financial statements and (2) involved our especially challenging, subjective, or complex judgments. The communication of critical audit matters does not alter in any way our opinion on the financial statements, taken as a whole, and we are not, by communicating the critical audit matter below, providing a separate opinion on the critical audit matter or on the accounts or disclosures to which it relates.
Consolidated Financial Statements - Impact of Internal Control over Financial Reporting
As described in Management’s Report on Internal Control Over Financial Reporting, material weaknesses were identified as of December 31, 2022. The prevention, detection, and correction of material misstatements of the consolidated financial statements, is dependent, in part, on management (i) designing and maintaining an effective control environment, including maintaining sufficient resources within the accounting and financial reporting department to review complex financial reporting transactions; and updating and distributing accounting policies and procedures across the organization (ii) designing and implementing effective information and communication process to identify and assess the source of and controls necessary to ensure the reliability of information used in financial reporting and that communicates relevant information about roles and responsibilities for internal control over financial reporting and (iii) designing and implementing effective process-level control activities and general information technology controls related to financial reporting processes. We identified the impact on our audit of the material weaknesses related to the control environment, information and communication, and control activities (“material weaknesses”), as further described in Management’s Report, as a critical audit matter.
The principal consideration for our determination that the impact on our audit of the material weaknesses is a critical audit matter is that especially challenging auditor judgment was required in designing audit procedures and evaluating audit evidence due to the ineffective system of internal control over financial reporting, which affects substantially all consolidated financial statement account balances and disclosures.
Our audit procedures related to the material weaknesses included the following, among others.
a.We determined the nature and extent of audit procedures that are responsive to the identified material weaknesses and evaluated the evidence obtained from the procedures performed.
b.We lowered the threshold used for investigating differences noted for recorded amounts.
c.We selected larger sample sizes for tests of details.
d.We substantively tested the accuracy and completeness of system-generated reports used in the audit and more extensively tested these reports.
e.We increased the extent of supervision over the execution of audit procedures.
/s/ Grant Thornton LLP
We have served as the Company’s auditor since 2022.
Denver, Colorado
March 15, 2023
Report of Independent Registered Public Accounting Firm
Board of Directors and Stockholders
GrowGeneration Corp.
Opinion on internal control over financial reporting
We have audited the internal control over financial reporting of GrowGeneration Corp. (the “Company”) as of December 31, 2022, based on criteria established in the 2013 Internal Control—Integrated Framework issued by the Committee of Sponsoring Organizations of the Treadway Commission (“COSO”). In our opinion, because of the effect of the material weaknesses described in the following paragraphs on the achievement of the objectives of the control criteria, the Company has not maintained effective internal control over financial reporting as of December 31, 2022, based on criteria established in the 2013 Internal Control—Integrated Framework issued by COSO.
A material weakness is a deficiency, or combination of control deficiencies, in internal control over financial reporting, such that there is a reasonable possibility that a material misstatement of the company’s annual or interim financial statements will not be prevented or detected on a timely basis. The following material weaknesses has been identified and included in management’s assessment.
•Control Environment: The Company did not maintain an effective control environment based on the criteria established in the COSO framework, which resulted in deficiencies in principles associated with the control environment.
In addition, the following material weaknesses were previously identified and contributed to the material weakness in the control environment:
•Insufficient resources within the accounting and financial reporting department to review the accounting of complex financial reporting transactions including areas such as business combinations, share based compensation and the related income tax reporting.
•Ineffective controls over updating and distributing accounting policies and procedures across the organization.
The control environment material weaknesses contributed to other material weaknesses within the Company’s system of internal controls over financial reporting related to the following COSO components:
•Risk Assessment: The Company did not design and implement an effective risk assessment based on the criteria established in the COSO framework and identified deficiencies in the principles associated with the risk assessment component of the COSO framework.
•Information and Communication: The Company did not have an effective information and communication process that identified and assessed the source of and controls necessary to ensure the reliability of information used in financial reporting and that communicates relevant information about roles and responsibilities for internal control over financial reporting.
•Monitoring Activities: The Company did not have effective monitoring activities to assess the operation of internal control over financial reporting, including the continued appropriateness of control design and level of documentation maintained to support control effectiveness.
•Control Activities: As a consequence of the material weaknesses described above, internal control deficiencies related to the design and operation of process-level controls and general information technology controls were determined to be pervasive throughout the Company’s financial reporting processes.
In addition, the following material weaknesses were previously identified and contributed to the material weakness in control activities:
•Inadequate information and technology general controls, including segregation of duties, change management, and user access, which were inadequate to support financial reporting applications and support automated controls and functionality.
•Inadequate controls over physical inventory counts.
•Inadequate controls over valuations, inclusive of appropriate valuation model inputs and appropriate forecasting for prospective financial information.
•Inadequate segregation of duties within human resources, manual journal entry posting processes, and various bank accounts of the Company to prevent and detect unauthorized transactions in a timely manner.
We also have audited, in accordance with the standards of the Public Company Accounting Oversight Board (United States) (“PCAOB”), the consolidated financial statements of the Company as of and for the year ended December 31, 2022. The material weaknesses identified above were considered in determining the nature, timing, and extent of audit tests applied in our audit of the 2022 consolidated financial statements, and this report does not affect our report dated March 15, 2023, which expressed an unqualified opinion on those financial statements.
Basis for opinion
The Company’s management is responsible for maintaining effective internal control over financial reporting and for its assessment of the effectiveness of internal control over financial reporting, included in the accompanying Management’s Report on Internal Control Over Financial Reporting. Our responsibility is to express an opinion on the Company’s internal control over financial reporting based on our audit. We are a public accounting firm registered with the PCAOB and are required to be independent with respect to the Company in accordance with the U.S. federal securities laws and the applicable rules and regulations of the Securities and Exchange Commission and the PCAOB.
We conducted our audit in accordance with the standards of the PCAOB. Those standards require that we plan and perform the audit to obtain reasonable assurance about whether effective internal control over financial reporting was maintained in all material respects. Our audit included obtaining an understanding of internal control over financial reporting, assessing the risk that a material weakness exists, testing and evaluating the design and operating effectiveness of internal control based on the assessed risk, and performing such other procedures as we considered necessary in the circumstances. We believe that our audit provides a reasonable basis for our opinion.
Definition and limitations of internal control over financial reporting
A company’s internal control over financial reporting is a process designed to provide reasonable assurance regarding the reliability of financial reporting and the preparation of financial statements for external purposes in accordance with generally accepted accounting principles. A company’s internal control over financial reporting includes those policies and procedures that (1) pertain to the maintenance of records that, in reasonable detail, accurately and fairly reflect the transactions and dispositions of the assets of the company; (2) provide reasonable assurance that transactions are recorded as necessary to permit preparation of financial statements in accordance with generally accepted accounting principles, and that receipts and expenditures of the company are being made only in accordance with authorizations of management and directors of the company; and (3) provide reasonable assurance regarding prevention or timely detection of unauthorized acquisition, use, or disposition of the company’s assets that could have a material effect on the financial statements.
Because of its inherent limitations, internal control over financial reporting may not prevent or detect misstatements. Also, projections of any evaluation of effectiveness to future periods are subject to the risk that controls may become inadequate because of changes in conditions, or that the degree of compliance with the policies or procedures may deteriorate.
/s/ Grant Thornton LLP
Denver, Colorado
March 15, 2023
REPORT OF INDEPENDENT REGISTERED PUBLIC ACCOUNTING FIRM
To the Stockholders and Board of Directors of GrowGeneration Corp.
Opinion on the Financial Statements
We have audited the accompanying consolidated balance sheets of GrowGeneration Corp. (the “Company”) as of December 31, 2021, the related consolidated statements of operations, stockholders' equity, and cash flows for each of the years in the two-year period ended December 31, 2021, and the related notes (collectively referred to as the “financial statements”). In our opinion, the financial statements referred to above present fairly, in all material respects, the financial position of the Company as of December 31, 2021, and the results of its operations and its cash flows for each of the years in the two-year period ended December 31, 2021, in conformity with accounting principles generally accepted in the United States of America.
Basis for Opinion
The Company's management is responsible for these financial statements. Our responsibility is to express an opinion on the Company’s financial statements based on our audits. We are a public accounting firm registered with the PCAOB and are required to be independent with respect to the Company in accordance with the U.S. federal securities laws and the applicable rules and regulations of the Securities and Exchange Commission and the PCAOB.
We conducted our audits in accordance with the standards of the PCAOB. Those standards require that we plan and perform the audit to obtain reasonable assurance about whether the financial statements are free of material misstatement, whether due to error or fraud. Our audits included performing procedures to assess the risks of material misstatement of the financial statements, whether due to error or fraud, and performing procedures that respond to those risks. Such procedures included examining, on a test basis, evidence regarding the amounts and disclosures in the financial statements. Our audits also included evaluating the accounting principles used and significant estimates made by management, as well as evaluating the overall presentation of the financial statements. We believe that our audits provide a reasonable basis for our opinion.
/s/ Plante & Moran, PLLC
Denver, Colorado
March 9, 2022, except for the effects of the change in segments described in Notes 2, 6, 14 and 17, as to which the date is March 15, 2023
We served as the Company’s auditor from 2020-2022.
GROWGENERATION CORP. AND SUBSIDIARIES
CONSOLIDATED BALANCE SHEETS
(in thousands except shares)
| | | | | | | | | | | |
| December 31,
2022 | | December 31,
2021 |
| ASSETS | | | |
| Current assets: | | | |
| Cash and cash equivalents | $ | 40,054 | | | $ | 41,372 | |
| Marketable securities | 31,852 | | | 39,793 | |
Accounts receivable, net of allowance for doubtful accounts of $0.7 million and $0.6 million at December 31, 2022 and 2021 | 8,336 | | | 5,741 | |
Notes receivable, current, net of allowance for doubtful accounts of $1,268 and $522 at December 31, 2022 and 2021 | 1,214 | | | 2,440 | |
| Inventory | 77,091 | | | 105,571 | |
| Prepaid income taxes | 5,679 | | | 5,856 | |
| Prepaids and other current assets | 6,455 | | | 16,116 | |
| Total current assets | 170,681 | | | 216,889 | |
| | | |
| Property and equipment, net | 28,669 | | | 24,116 | |
| Operating leases right-of-use assets | 46,433 | | | 43,730 | |
| Intangible assets, net | 30,878 | | | 48,402 | |
| Goodwill | 15,978 | | | 125,401 | |
| Other assets | 803 | | | 800 | |
| TOTAL ASSETS | $ | 293,442 | | | $ | 459,338 | |
| | | |
| LIABILITIES & STOCKHOLDERS’ EQUITY | | | |
| Current liabilities: | | | |
| Accounts payable | $ | 15,728 | | | $ | 17,033 | |
| Accrued liabilities | 1,535 | | | 2,044 | |
| Payroll and payroll tax liabilities | 4,671 | | | 7,440 | |
| Customer deposits | 4,338 | | | 11,686 | |
| Sales tax payable | 1,341 | | | 1,923 | |
| Current maturities of operating lease liability | 8,131 | | | 6,858 | |
| Current portion of long-term debt | 50 | | | 92 | |
| Total current liabilities | 35,794 | | | 47,076 | |
| | | |
| Deferred tax liability | — | | | 2,359 | |
| Operating lease liability, net of current maturities | 40,659 | | | 38,546 | |
| Long-term debt, net of current portion | — | | | 66 | |
| Other long-term liabilities | 593 | | | — | |
| Total liabilities | 77,046 | | | 88,047 | |
| Commitments and contingencies (Note 18) | | | |
| Stockholders’ Equity: | | | |
Common stock; $.001 par value; 100,000,000 shares authorized; 61,010,155 and 59,928,564 shares issued and outstanding as of December 31, 2022 and 2021, respectively | 61 | | | 60 | |
| Additional paid-in capital | 369,938 | | | 361,087 | |
| Retained earnings (deficit) | (153,603) | | | 10,144 | |
| Total stockholders’ equity | 216,396 | | | 371,291 | |
| TOTAL LIABILITIES AND STOCKHOLDERS’ EQUITY | $ | 293,442 | | | $ | 459,338 | |
The accompanying notes are an integral part of these audited consolidated financial statements.
GROWGENERATION CORP. AND SUBSIDIARIES
CONSOLIDATED STATEMENTS OF OPERATIONS
(in thousands, except per share)
| | | | | | | | | | | | | | | | | |
| For the Years Ended December 31, |
| 2022 | | 2021 | | 2020 |
| Sales, net | $ | 278,166 | | | $ | 422,489 | | | $ | 193,365 | |
| Cost of sales (exclusive of depreciation and amortization shown below) | 207,903 | | | 304,248 | | | 142,317 | |
| Gross profit | 70,263 | | | 118,241 | | | 51,048 | |
| | | | | |
| Operating expenses: | | | | | |
| Store operations and other operational expenses | 54,680 | | | 49,742 | | | 18,724 | |
| Selling, general, and administrative | 36,758 | | | 39,469 | | | 20,871 | |
| Bad debt expense | 1,737 | | | 1,428 | | | 580 | |
Depreciation and amortization | 17,132 | | | 12,600 | | | 2,436 | |
| Impairment loss | 127,831 | | | — | | | — | |
Total operating expenses | 238,138 | | | 103,239 | | | 42,611 | |
| | | | | |
| Income (Loss) from operations | (167,875) | | | 15,002 | | | 8,437 | |
| | | | | |
| Other income (expense): | | | | | |
Miscellaneous income (expense) | 684 | | | (216) | | | 112 | |
Interest income | 580 | | | 486 | | | 44 | |
Interest expense | (21) | | | (43) | | | (14) | |
Total non-operating income (expense), net | 1,243 | | | 227 | | | 142 | |
| | | | | |
| Net income (loss) before taxes | (166,632) | | | 15,229 | | | 8,579 | |
| | | | | |
| Benefit (provision) for income taxes | 2,885 | | | (2,443) | | | (3,251) | |
| | | | | |
| Net income (loss) | $ | (163,747) | | | $ | 12,786 | | | $ | 5,328 | |
| | | | | |
| Net income (loss) per share, basic | $ | (2.69) | | | $ | 0.22 | | | $ | 0.12 | |
| Net income (loss) per share, diluted | $ | (2.69) | | | $ | 0.21 | | | $ | 0.11 | |
| | | | | |
| Weighted average shares outstanding, basic | 60,813 | | | 59,223 | | | 43,945 | |
| Weighted average shares outstanding, diluted | 60,813 | | | 60,464 | | | 46,456 | |
The accompanying notes are an integral part of these audited consolidated financial statements.
GROWGENERATION CORP. AND SUBSIDIARIES
CONSOLIDATED STATEMENTS OF STOCKHOLDERS’ EQUITY
FOR THE YEARS ENDED DECEMBER 31, 2022, 2021, and 2020
(in thousands)
| | | | | | | | | | | | | | | | | | | | | | | | | | | | | |
| Common Stock | | Additional
Paid-In
Capital | | Retained Earnings (Deficit) | | Total
Stockholders’
Equity |
| Shares | | Amount | | | |
| Balances, December 31, 2019 | 36,878 | | | $ | 37 | | | $ | 60,742 | | | $ | (7,970) | | | $ | 52,809 | |
| | | | | | | | | |
| Sale of common stock, net of fees | 14,375 | | | 14 | | | 207,120 | | | — | | | 207,134 | |
| Common stock issued upon warrant exercise | 1,370 | | | 1 | | | 3,841 | | | — | | | 3,842 | |
| Common stock issued upon cashless exercise of warrants | 918 | | | 1 | | | (1) | | | — | | | — | |
| Common stock issued upon exercise of options | 71 | | | — | | | 230 | | | — | | | 230 | |
| Common stock issued upon cashless exercise of options | 694 | | | 1 | | | (1) | | | — | | | — | |
| Common stock issued in connection with business combinations | 1,730 | | | 2 | | | 39,145 | | | — | | | 39,147 | |
| Common stock issued for assets | 20 | | | — | | | 136 | | | — | | | 136 | |
| Common stock issued for services | 50 | | | — | | | — | | | — | | | — | |
| Common stock issued for accrued payroll | 325 | | | — | | | 717 | | | — | | | 717 | |
| Common stock issued for accrued share-based compensation | 729 | | | 1 | | | 3,797 | | | — | | | 3,798 | |
| Share based compensation, net of shares withheld for employee tax liability | (8) | | | — | | | 3,856 | | | — | | | 3,856 | |
| Net income (loss) | — | | | — | | | — | | | 5,328 | | | 5,328 | |
| Balances, December 31, 2020 | 57,152 | | | $ | 57 | | | $ | 319,582 | | | $ | (2,642) | | | $ | 316,997 | |
| | | | | | | | | |
| Common stock issued upon warrant exercise | 256 | | | — | | | 335 | | | — | | | 335 | |
| Common stock issued upon cashless exercise of warrants | 657 | | | 1 | | | (1) | | | — | | | — | |
| Common stock issued upon exercise of options | 469 | | | 1 | | | 1,757 | | | — | | | 1,758 | |
| Common stock issued upon cashless exercise of options | 325 | | | — | | | — | | | — | | | — | |
| Common stock issued in connection with business combinations | 807 | | | 1 | | | 37,271 | | | — | | | 37,272 | |
| Common stock issued in connection with purchase of intangible assets | 4 | | | — | | | 168 | | | — | | | 168 | |
| Common stock issued for share based compensation | 204 | | | — | | | — | | | — | | | — | |
| Common stock issued for services | 145 | | | — | | | 717 | | | — | | | 717 | |
| Common stock redeemed in litigation settlement | (90) | | | — | | | — | | | — | | | — | |
| Share based compensation, net of shares withheld for employee tax liability | — | | | — | | | 1,258 | | | — | | | 1,258 | |
| Net income (loss) | — | | | — | | | — | | | 12,786 | | | 12,786 | |
| Balances, December 31, 2021 | 59,929 | | | $ | 60 | | | $ | 361,087 | | | $ | 10,144 | | | $ | 371,291 | |
| | | | | | | | | |
| Common stock issued in connection with business combinations | 700 | | | 1 | | | 5,710 | | | — | | | 5,711 | |
| Adjustment for prior period acquisition | — | | | — | | | 39 | | | — | | | 39 | |
| Common stock issued for share based compensation | 339 | | | — | | | — | | | — | | | — | |
| Share based compensation | — | | | — | | | 4,514 | | | — | | | 4,514 | |
| Common stock redemption | — | | | — | | | (1,618) | | | — | | | (1,618) | |
| Common stock issued upon exercise of options | 9 | | | — | | | 33 | | | — | | | 33 | |
| Common stock issued upon cashless exercise of options | 20 | | | — | | | — | | | — | | | — | |
| Common stock issued upon cashless exercise of warrants | 14 | | | — | | | — | | | — | | | — | |
| Common stock issued in connection with asset acquisition | 50 | | | — | | | 173 | | | — | | | 173 | |
| Net income (loss) | — | | | — | | | — | | | (163,747) | | | (163,747) | |
| Balances, December 31, 2022 | 61,061 | | | $ | 61 | | | $ | 369,938 | | | $ | (153,603) | | | $ | 216,396 | |
The accompanying notes are an integral part of these audited consolidated financial statements.
GROWGENERATION CORP. AND SUBSIDIARIES
CONSOLIDATED STATEMENTS OF CASH FLOWS
(in thousands)
| | | | | | | | | | | | | | | | | |
| Years Ended December 31, |
| 2022 | | 2021 | | 2020 |
| Cash Flows from Operating Activities: | | | | | |
| Net income (loss) | $ | (163,747) | | | $ | 12,786 | | | $ | 5,328 | |
| Adjustments to reconcile net income (loss) to net cash provided by (used in) operating activities: | | | | | |
| Depreciation and amortization | 17,132 | | | 12,600 | | | 2,436 | |
| Bad debt expense, net of recoveries | 1,737 | | | 1,428 | | | 580 | |
| Stock based compensation | 4,967 | | | 6,585 | | | 7,856 | |
| Impairment loss | 127,831 | | | — | | | — | |
| Provision for deferred income taxes | (2,359) | | | 1,609 | | | 750 | |
| Loss on disposal of fixed assets | 568 | | | 198 | | | — | |
| Other | — | | | — | | | (127) | |
| Changes in operating assets and liabilities: | | | | | |
| (Increase) decrease in: | | | | | |
| Accounts and notes receivable | (3,106) | | | (1,896) | | | (3,837) | |
| Inventory | 32,890 | | | (34,690) | | | (19,188) | |
| Prepaid expenses and other assets | 10,827 | | | (9,937) | | | (9,236) | |
| Increase (decrease) in: | | | | | |
| Accounts payable and accrued liabilities | (3,359) | | | 3,285 | | | 9,989 | |
| Operating leases | 508 | | | 1,282 | | | 375 | |
| Customer deposits | (8,590) | | | 6,362 | | | 2,651 | |
| Payroll and payroll tax liabilities | (2,769) | | | 4,785 | | | 1,583 | |
| Sales taxes payable | (582) | | | 762 | | | 627 | |
| Net Cash and Cash Equivalents Provided By (Used In) Operating Activities | 11,948 | | | 5,159 | | | (213) | |
| Cash Flows from Investing Activities: | | | | | |
| Assets acquired in business combinations, net of cash acquired | (7,230) | | | (80,784) | | | (41,402) | |
| Purchase of property and equipment | (12,896) | | | (18,740) | | | (3,401) | |
| Purchase of marketable securities | (38,692) | | | (75,000) | | | — | |
| Maturities of marketable securities | 46,633 | | | 35,207 | | | — | |
| Disposal of assets | 612 | | | — | | | — | |
| Purchase of intangibles | — | | | — | | | (1,027) | |
| Net Cash and Cash Equivalents (Used In) Investing Activities | (11,573) | | | (139,317) | | | (45,830) | |
| Cash Flows from Financing Activities: | | | | | |
| Principal payments on long term debt | (108) | | | (83) | | | (111) | |
| Payments to tax authorities for stock-based compensation | (1,618) | | | (4,391) | | | (119) | |
| Proceeds from the sales of common stock and exercise of warrants and options, net of expenses | 33 | | | 2,092 | | | 211,206 | |
| Net Cash and Cash Equivalents (Used In) Provided by Financing Activities | (1,693) | | | (2,382) | | | 210,976 | |
| | | | | |
| Net Increase (decrease) in Cash and Cash Equivalents | (1,318) | | | (136,540) | | | 164,933 | |
| Cash and Cash Equivalents at Beginning of year | 41,372 | | | 177,912 | | | 12,979 | |
| Cash and Cash Equivalents at End of year | $ | 40,054 | | | $ | 41,372 | | | $ | 177,912 | |
| | | | | |
| Supplemental Information: | | | | | |
| Common stock issued for intangible assets | $ | 173 | | | $ | 168 | | | $ | — | |
| Common stock issued for accrued payroll liability | $ | — | | | $ | — | | | $ | 718 | |
| Assets acquired by issuance of stock | $ | 5,710 | | | $ | 37,272 | | | $ | 39,282 | |
| Cash paid for interest | $ | 21 | | | $ | 43 | | | $ | 14 | |
| Right to use assets acquired under new operating leases | $ | 9,607 | | | $ | 32,875 | | | $ | 7,887 | |
| Cash paid for income taxes | $ | — | | | $ | 6,072 | | | $ | 3,156 | |
The accompanying notes are an integral part of these audited consolidated financial statements.
GROWGENERATION CORP. AND SUBSIDIARIES
NOTES TO CONSOLIDATED FINANCIAL STATEMENTS
1. NATURE OF OPERATIONS
GrowGeneration Corp. (the “Company”, "we", "us", and "our") was incorporated on March 6, 2014 in Colorado under the name of Easylife Corp and changed its name to GrowGeneration Corp. It maintains its principal office in Denver, Colorado.
GrowGeneration is the largest chain of hydroponic garden centers in the U.S. by management's estimates and is a marketer and distributor of nutrients, growing media, lighting, ventilation systems and other products for hydroponic and organic gardening. The Company also engages in the distribution of private label products and commercial benching. Currently, the Company owns and operates a chain of 59 retail hydroponic/gardening stores across 16 states, an online e-commerce platform, and propriety businesses that market grow solutions through our platforms and other wholesale customers. The Company’s plan is to continue to acquire, open and operate hydroponic/gardening stores and related businesses throughout the United States.
2. SUMMARY OF SIGNIFICANT ACCOUNTING POLICIES
Basis of Presentation and Consolidation
The consolidated financial statements are prepared under the Financial Accounting Standards Board (“FASB”) Accounting Standards Codification (“ASC”) Topic 105-10, Generally Accepted Accounting Principles, in accordance with accounting principles generally accepted in the U.S. (“GAAP”).
The consolidated financial statements include the Company and its wholly-owned subsidiaries. All intercompany balances and transactions are eliminated in consolidation.
All amounts included in the accompanying notes to the consolidated financial statements, except per share data, are in thousands (000).
Reclassifications
Certain amounts in the prior period consolidated financial statements have been reclassified to conform to the current period presentation. These reclassifications had no effect on reported consolidated net income.
Use of Estimates
Management uses estimates and assumptions in preparing these consolidated financial statements in accordance with generally accepted accounting principles. These estimates and assumptions affect the reported amounts of assets and liabilities, the disclosure of contingent assets and liabilities at the date of the consolidated financial statements, and the reported revenues and expenses during the reporting period. Actual results could vary from the estimates that were used.
Risks and Uncertainties
The COVID-19 pandemic has created significant public health concerns as well as economic disruption, uncertainty, and volatility which may negatively affect our business operations. As a result, if the pandemic or its effects persist or worsen, our accounting estimates and assumptions could be impacted in subsequent interim reports and upon final determination at year-end, and it is reasonably possible such changes could be significant (although the potential effects cannot be estimated at this time). Although the COVID-19 pandemic to date has resulted in supply chain delays of our inventory, higher operating costs and increased shipping costs, among other impacts, we have experienced minimal business interruption as a result of the COVID-19 pandemic.
Although many impacts of the COVID-19 pandemic appear to have alleviated, the pandemic has not yet been eliminated, and we cannot predict future impacts of the COVID-19 pandemic, if any, on markets generally or on our operations or the operations of our customers and suppliers. It is possible that some impacts of the pandemic on markets will persist for some time. These measures have negatively impacted, and may continue to impact, our business and financial condition as the responses to control COVID-19 continue.
GROWGENERATION CORP. AND SUBSIDIARIES
NOTES TO CONSOLIDATED FINANCIAL STATEMENTS
Immaterial out-of-period adjustments
During the year ended December 31, 2022, the Company recorded an immaterial out-of-period adjustment that impacted the prior year Consolidated Balance Sheets. The adjustment related to a change in the calculation of operating lease right-of-use assets and operating lease liabilities. This adjustment corrected an understatement of operating lease right-of-use assets of $1.3 million and an understatement of operating lease liabilities of $1.3 million as of December 31, 2021. The Company assessed the materiality of this adjustment on the previously issued annual financial statements in accordance with SEC Staff Accounting Bulletin No. 99. The Company concluded that the changes were not material to any of the previously issued consolidated financial statements.
During the year ended December 31, 2022, the Company recorded an immaterial out-of-period adjustment that impacted the prior year Consolidated Balance Sheet related to the accumulation of errors that occurred over several periods. This adjustment corrected an understatement of operating lease right-of-use assets of $1.4 million and an understatement of operating lease liabilities of $1.4 million as of December 31, 2021. The Company assessed the materiality of this adjustment on the previously issued annual financial statements in accordance with SEC Staff Accounting Bulletin No. 99. The Company concluded that the changes were not material to any of the previously issued consolidated financial statements.
Segment Reporting
During the year ended December 31, 2022, the Company identified an omission regarding the disclosure of reportable segments under ASC 280 related to the year ended December 31, 2021. During the year ended December 31, 2021 the Company inappropriately reported a single segment, aggregating multiple operating segments. The impact at December 31, 2021 was that $17.1 million of revenue, $7.0 million of gross margin, and $2.9 million of operating income should have been reported as a separate “Distribution and other segment.” The Company assessed the materiality of this omission on the previously issued interim and annual consolidated financial statements in accordance with SEC Staff Accounting Bulletin No. 99. The Company concluded that the omission was not material to any of the previously issued consolidated financial statements and began reporting segments results in accordance with ASC 280 on a prospective basis starting with the quarter ended March 31, 2022.
Revenue Recognition
The Company’s revenue is primarily generated from sales of branded and non-branded products through our retail locations, e-commerce platforms, and distribution centers. In addition to these product sales, the Company sells and installs commercial fixtures.
The Company allocates transaction price to each distinct performance obligation and recognizes revenue, net of estimated returns and sales tax, at the time when it transfers control of the product to customers or when services are completed. Revenues are measured based on the amount of consideration that the Company expects to receive as derived from a list price, reduced by estimates for variable consideration. The variable consideration is based on the estimate of expected sales returns. The majority of our returns come from retail sales. Estimating future returns requires judgment based on current and historical trends and actual returns may vary from our estimates.
In evaluating the timing of the transfer of control of products to customers, the Company considers several control indicators, including significant risks and rewards of products, the Company’s right to payment and the legal title of the products. Based on the assessment of control indicators, product sales are typically recognized when they are made available to the carrier or are picked up by the customer. Promises related to product installation are considered a separate performance obligation from the product sale given the products can be used without customization or modification, and installation is not complex and can be performed by other vendors. Installation revenue is recognized upon completion of the installation service to the customer. The Company has applied the practical expedient to exclude the value of remaining performance obligations for contracts with an original term of one year or less.
Sales and other taxes collected concurrent with revenue producing activities are excluded from revenue. Payment for goods and services sold by the Company is typically due upon satisfaction of the performance obligations. Under certain circumstances, the Company does provide goods and services to customers on a credit basis (see Accounts Receivable,
GROWGENERATION CORP. AND SUBSIDIARIES
NOTES TO CONSOLIDATED FINANCIAL STATEMENTS
Notes Receivable and Concentration of Credit Risk below). The Company accounts for shipping and handling activities as a fulfillment cost rather than as a separate performance obligation. As such, the Company classifies such costs as a component of cost of sales on the consolidated statements of operations. When the Company receives payment from customers before the customer obtains control of the merchandise or the service has been performed, the amount received is recorded as a customer deposit in the accompanying consolidated balance sheets until the sale or service is complete.
Cost of Sales
Cost of sales includes cost of goods and shipping costs. Cost of goods consists of cost of merchandise, inbound freight and other inventory-related costs, such as shrinkage costs and lower of cost or market adjustments. Occupancy expenses, which consist of payroll, rent and other lease required costs, including common area maintenance and utilities, are included as a component of store operations and other operational expenses on the consolidated statements of operations.
Cash Equivalents
The Company considers all highly liquid investments purchased with original maturities of three months or less to be cash equivalents. The Company’s cash equivalents consist primarily of money market funds.
Financial instruments that potentially expose us to concentrations of risk consist primarily of cash and cash equivalents and accounts receivable, which are generally not collateralized. Our policy is to place our cash and cash equivalents with high quality financial institutions, in order to limit the amount of credit exposure. Accounts at each institution are insured by the Federal Deposit Insurance Corporation (FDIC), up to $250,000. At December 31, 2022 and 2021, the Company had approximately $37 million and $38 million, respectively, in excess of the FDIC insurance limit.
Securities
The Company classifies its commercial paper and debt securities as marketable securities. Marketable securities with available fair market values are stated at fair market values. Realized gains or losses on sale of marketable securities are computed using primarily the moving average cost and reported in net income. For the year ended December 31, 2022, 2021, and 2020, there were no significant unrealized gains or losses incurred.
Accounts Receivable, Notes Receivable and Concentration of Credit Risk
Accounts receivable are stated at the amount the Company expects to collect from balances outstanding at period-end, based on the Company’s assessment of the credit history with customers having outstanding balances and current relationships with them. A reserve for uncollectible receivables is established when collection of amounts due is deemed improbable. Indicators of improbable collection include client bankruptcy, client litigation, client cash flow difficulties or ongoing service or billing disputes. Credit is generally extended on a short-term basis thus receivables do not bear interest. Interest on past due balances are subject to an interest charge of 1.5% per month.
Notes receivable are stated at the amount the Company expects to collect from balances outstanding at period-end, based on the Company’s assessment of the credit history with customers having outstanding balances and current relationships with them. A reserve for uncollectible receivables is established when collection of amounts due is deemed improbable. Indicators of improbable collection include client bankruptcy, client litigation, client cash flow difficulties or ongoing service or billing disputes. A note is placed on non-accrual status when management determines, after considering economic and business conditions and collection efforts, that the note is impaired or collection of interest is doubtful. The accrual of interest on the instrument ceases when there is concern that principal or interest due according to the note agreement will not be collected. Any payment received on such non-accrual notes are recorded as interest income when the payment is received. The note is reclassified as accrual-basis once interest and principal payments become current. The Company periodically reviews the value of the underlying collateral for the note receivable and evaluates whether the value of the collateral continues to provide adequate security for the note. Should the value of the underlying collateral become less than the outstanding principal and interest, the Company will determine whether an allowance is necessary. Any uncollectible interest previously accrued is also charged off. As of December 31, 2022 and 2021, the Company believes the value of the underlying collateral for each of the notes to be sufficient and in excess of the respective outstanding principal and accrued interest, net of recognized allowance.
GROWGENERATION CORP. AND SUBSIDIARIES
NOTES TO CONSOLIDATED FINANCIAL STATEMENTS
Notes receivable generally have terms of 12 months to 18 months and bear interest from 6-12% per annum. Generally, product sales that are the basis for the note receivable are collateral on the note receivable until the note is paid off.
We are exposed to credit risk in the normal course of business, primarily related to accounts and notes receivable. We are affected by general economic conditions in the U.S. To limit credit risk, management periodically reviews and evaluates the financial condition of its customers and maintains an allowance for doubtful accounts. As of December 31, 2022 and 2021, we do not believe that we have significant credit risk.
Inventory
Inventory consists primarily of gardening supplies and materials, fixtures, and equipment and is recorded at the lower of cost (weighted average cost method) or net realizable value. The Company periodically reviews the value of items in inventory and provides write-downs or write-offs of inventory based on its assessment of market conditions. Write-downs and write-offs are charged to cost of sales. During the years ended December 31, 2022, 2021, and 2020, the Company recorded $7.8 million, $5.3 million, and $1.7 million to inventory write-downs due to shrink and obsolescence.
Property and Equipment
Property and equipment are carried at cost. Leasehold improvements are amortized using the straight-line method over the original term of the lease or the useful life of the improvement, whichever is shorter. Renewals and betterment that materially extend the life of the asset are capitalized. With respect to constructed assets, all materials, direct labor, contract services as well as certain indirect costs are capitalized. Expenditures for maintenance and repairs are charged against operations. Depreciation of property and equipment is provided on the straight-line method for financial reporting purposes at rates based on the following estimated useful lives:
| | | | | |
| Estimated Lives |
| Vehicles | 5 years |
| Buildings | 20 - 30 years |
| Furniture and fixtures | 3 -7 years |
| Computers and equipment | 3-5 years |
| Leasehold improvements | 5 years not to exceed lease term |
Software and Website Development Costs
The Company accounts for the costs of computer software obtained or developed for internal use in accordance with FASB ASC 350, Intangibles—Goodwill and Other. Computer software development costs and website development costs are expensed as incurred, except for internal use software or website development costs that qualify for capitalization as described below, and include certain employee related expenses, including salaries, bonuses, benefits and stock-based compensation expenses; costs of computer hardware and software; and costs incurred in developing features and functionality. These capitalized costs are included in property and equipment on the consolidated balance sheets.
•The Company expenses costs incurred in the preliminary project and post-implementation stages of software development and capitalizes costs incurred in the application development stage and costs associated with significant enhancements to existing internal use software applications.
•Software costs are amortized using the straight-line method over an estimated useful life of three years commencing when the software project is ready for its intended use.
•Costs incurred related to less significant modifications and enhancements as well as maintenance are expensed as incurred.
GROWGENERATION CORP. AND SUBSIDIARIES
NOTES TO CONSOLIDATED FINANCIAL STATEMENTS
Intangible Assets Acquired in Business Combinations
The Company values assets acquired and liabilities assumed on each acquisition accounted for as a business combination, and allocates the purchase price to the tangible and intangible assets acquired and liabilities assumed based on its best estimate of fair value. Acquired intangible assets include trade names, customer relationships, non-compete agreements, and intellectual property. The Company determines the appropriate useful life of intangible assets by performing an analysis of cash flows based on historical experience of the acquired businesses. Intangible assets are amortized over their estimated useful lives based on the pattern in which the economic benefits associated with the asset are expected to be consumed, which to date has approximated the straight-line method of amortization. The estimated useful lives for trade names, customer relationships, non-compete agreements, and intellectual property are generally five years.
Goodwill
Goodwill represents the excess of purchase price over the fair value of net assets. Goodwill is not amortized but is reviewed for potential impairment on an annual basis, or if events or circumstances indicate a potential impairment, at the reporting unit level. The Company’s review for impairment includes an assessment of qualitative factors to determine whether it is more likely than not that the fair value of a reporting unit is less than its carrying value, including goodwill. If it is determined that it is more likely than not that the fair value of a reporting unit is less than its carrying value, including goodwill, a quantitative goodwill impairment test is performed, which compares the fair value of the reporting unit with its carrying amounts, including goodwill. If the fair value of the reporting unit exceeds its carrying amount, goodwill of the reporting unit is considered not impaired. However, if the carrying amount of the reporting unit exceeds its fair value, additional procedures must be performed. An impairment loss is recorded to the extent that the carrying amount of goodwill exceeds its fair value.
Long-lived assets
The Company reviews the recoverability of long-lived assets, including buildings, furniture and fixtures, computers and equipment, leasehold improvements, right-of-use assets, and other intangible assets, when events or changes in circumstances occur that indicate the carrying value of the asset may not be recoverable. The assessment of possible impairment is based on the ability to recover the carrying value of the asset from the expected future pretax cash flows (undiscounted and without interest charges) of the related operations. If these cash flows are less than the carrying value of such asset, an impairment loss is recognized for the difference between estimated fair value and carrying value. The measurement of impairment requires management to make estimates of these cash flows related to long-lived assets, as well as other fair value determinations. As of December 31, 2022, there were no indicators of impairment. See Note 6, Goodwill and Intangible Assets, for discussion of current year impairment.
Leases
We account for leases in accordance with the FASB ASC 842, Leases. We assess whether an arrangement is a lease at inception. Leases with an initial term of 12 months or less are not recorded on the balance sheet. We have elected the practical expedient to not separate lease and non-lease components for all assets. Operating lease assets and operating lease liabilities are calculated based on the present value of the future minimum lease payments over the lease term at the lease start date. As most of our leases do not provide an implicit rate, we use our incremental borrowing rate based on the information available at the lease start date in determining the present value of future payments. The operating lease asset is increased by any lease payments made at or before the lease start date and reduced by lease incentives and initial direct costs incurred. The lease term includes options to renew or terminate the lease when it is reasonably certain that we will exercise that option. The exercise of lease renewal options is at our sole discretion. The depreciable life of lease assets and leasehold improvements are limited by the lease term. Lease expense for operating leases is recognized on a straight-line basis over the lease term.
Fair Value Measurements
Fair value is defined as the exchange price that would be received for an asset or paid to transfer a liability (an exit price) in the principal or most advantageous market for the asset or liability in an orderly transaction between market participants on the measurement date. Valuation techniques used to measure fair value must maximize the use of observable inputs and
GROWGENERATION CORP. AND SUBSIDIARIES
NOTES TO CONSOLIDATED FINANCIAL STATEMENTS
minimize the use of unobservable inputs. Financial assets and liabilities carried at fair value are to be classified and disclosed in one of the following three levels of the fair value hierarchy, of which the first two are considered observable and the last is considered unobservable:
•Level 1—Quoted prices in active markets for identical assets or liabilities.
•Level 2—Observable inputs (other than Level 1 quoted prices), such as quoted prices in active markets for similar assets or liabilities, quoted prices in markets that are not active for identical or similar assets or liabilities, or other inputs that are observable or can be corroborated by observable market data.
•Level 3—Unobservable inputs that are supported by little or no market activity and that are significant to determining the fair value of the assets or liabilities, including pricing models, discounted cash flow methodologies and similar techniques.
To the extent that the valuation is based on models or inputs that are less observable or unobservable in the market, the determination of fair value requires more judgment. Accordingly, the degree of judgment exercised by the Company in determining fair value is greatest for instruments categorized in Level 3. A financial instrument’s level within the fair value hierarchy is based on the lowest level of any input that is significant to the fair value measurement.
The carrying amounts of cash and cash equivalents, accounts receivable, accounts payable and all other current liabilities approximate fair values due to their short-term nature. The fair value of notes receivable approximates the outstanding balance and are reviewed for impairment at least annually. The fair value of impaired notes receivable are determined based on estimated future payments discounted back to present value using the notes effective interest rate.
| | | | | | | | | | | | | | | | | |
| Level | | December 31, 2022 | | December 31, 2021 |
| Cash equivalents | 1 | | $ | 25,087 | | | $ | 23,346 | |
| Marketable securities | 2 | | $ | 31,852 | | | $ | 39,793 | |
Income Taxes
The Company accounts for income taxes in accordance with FASB ASC 740, Income Taxes, which requires the recognition of deferred tax assets and liabilities for future tax consequences attributable to differences between the financial statement carrying amounts of existing assets and liabilities and their respective tax basis and tax credit carry forwards. Deferred tax assets and liabilities are measured using enacted tax rates expected to apply to taxable income in the years in which those temporary differences are expected to be recovered or settled. The effect on deferred tax assets and liabilities of a change in tax rates is recognized in operations in the period that includes the enactment date. Valuation allowances are established to reduce deferred tax assets to the amount that will more likely than not be realized. To the extent that a determination was made to establish or adjust a valuation allowance, the expense or benefit is recorded in the period in which the determination is made.
From time to time, the Company engages in transactions in which the tax consequences may be subject to uncertainty. Significant judgment is required in assessing and estimating the tax consequences of these transactions. The Company prepares and files tax returns based on its interpretation of tax laws and regulations. In the normal course of business, the tax returns are subject to examination by various taxing authorities. Such examinations may result in future tax, interest and penalty assessments by these taxing authorities. In determining the Company’s income tax provision for financial reporting purposes, the Company establishes a reserve for uncertain income tax positions unless such positions are determined to be more likely than not of being sustained upon examination, based on their technical merits. That is, for financial reporting purposes, the Company only recognizes tax benefits taken on the tax return that the Company believes are more likely than not of being sustained upon examination. There is considerable judgment involved in determining whether a position taken on the tax return is more likely than not of being sustained.
The Company adjusts its tax reserve estimates periodically because of ongoing examinations by, and settlements with, the various taxing authorities, as well as changes in tax laws, regulations and interpretations. The consolidated income tax provision of any given year includes adjustments to prior year income tax accruals that are considered appropriate and any
GROWGENERATION CORP. AND SUBSIDIARIES
NOTES TO CONSOLIDATED FINANCIAL STATEMENTS
related estimated interest and penalties. The Company’s policy is to recognize, when applicable, interest and penalties on uncertain income tax positions as part of its income tax provision.
Advertising
The Company expenses advertising and promotional costs when incurred. Advertising and promotional expenses for the years ended December 31, 2022, 2021, and 2020 amounted to $4.0 million, $4.0 million, and $996 thousand respectively.
Earnings Per Share
The Company computes net earnings per share under ASC 260-10, Earnings Per Share. Basic earnings or loss per share (“EPS”) is computed by dividing net income (loss) available to common stockholders by the weighted average number of common shares outstanding for the period. Diluted EPS is computed by dividing net income (loss) by the weighted-average of all potentially dilutive shares of common stock that were outstanding during the periods presented.
The treasury stock method is used in calculating diluted EPS for potentially dilutive stock options, restricted stock and share purchase warrants, which assumes that any proceeds received from the exercise of in-the-money stock options, restricted stock and share purchase warrants, would be used to purchase common shares at the average market price for the period.
Stock Based Compensation
The Company records stock-based compensation in accordance with FASB ASC 718, Compensation-Stock Compensation. The Company estimates the fair value of stock options and warrants using the Black-Scholes option pricing model. The fair value of stock options and warrants granted is recognized as an expense over the requisite service period. Stock-based compensation expense for all share-based payment awards is recognized using the straight-line single-option method. Forfeitures are recognized as they occur.
The Black-Scholes option pricing model requires subjective assumptions, including future stock price volatility and expected time to exercise, which affect the calculated values. The expected term of options granted is derived from historical data on employee exercises and post-vesting employment termination behavior. The risk-free rate selected to value any particular grant is based on the U.S. Treasury rate that corresponds to the expected life of the grant effective as of the date of the grant. The expected volatility is based on the historical volatility of the Company’s stock price. These factors could change in the future, affecting the determination of stock-based compensation expense in future periods.
The Company also issued certain stock awards classified as liabilities based on the guidance set forth at ASC 480-10-25 and ASC 718-10-25. These awards entitle the employees to receive a specified dollar value of common stock on future dates ranging from June 15, 2023 through June 15, 2025. The awards generally vest over three years subject to the employee’s continued employment and are expensed using the straight-line method over the life of the award. For additional information see Note 9, Share Based Payments.
3. RECENT ACCOUNTING PRONOUNCEMENTS
From time to time, the Financial Accounting Standards Board (“FASB”) or other standard setting bodies issue new accounting pronouncements. Updates to the FASB Accounting Standards Codification are communicated through issuance of an Accounting Standards Update (“ASU”). We have implemented all new accounting pronouncements that are in effect and that may impact our consolidated financial statements. We have evaluated recently issued accounting pronouncements and determined that there is no material impact on our financial position or results of operations.
Recently Adopted Accounting Pronouncements
In June 2016, the FASB issued ASU No. 2016-13, Financial Instruments—Credit Losses (Topic 326), changing the impairment model for most financial instruments by requiring companies to recognize an allowance for expected losses, rather than incurred losses. The ASU will apply to most financial assets measured at amortized cost and certain other instruments, including trade and other receivables, loans, available-for-sale and held-to-maturity debt securities, net investments in leases, and off-balance-sheet credit exposures. The Company has adopted this standard effective January 1,
GROWGENERATION CORP. AND SUBSIDIARIES
NOTES TO CONSOLIDATED FINANCIAL STATEMENTS
2023. The adoption of this standard primarily applied to the valuation of the Company’s accounts receivable. Implementation of this standard did not have a material impact on our financial position.
4. REVENUE RECOGNITION
Disaggregation of Revenues
Sales are disaggregated by our segments, which represent our principal lines of business, as well as by our private label products versus distributed brands, or by commercial fixture revenue. See Note 17, Segments, for disaggregated revenue by segment.
Contract Balances
Depending on the timing of when title of product transfers to a customer and when a customer makes payments for such product, the Company recognizes a accounts receivable (asset) or a customer deposit (liability).
The opening and closing balances of the Company’s accounts receivables and customer deposits are as follows:
| | | | | | | | | | | |
| Accounts Receivable | | Customer Deposits |
| Opening balance, January 1, 2022 | $ | 5,741 | | | $ | 11,686 | |
| Closing balance, December 31, 2022 | 8,336 | | | 4,338 | |
| Increase (decrease) | $ | 2,595 | | | $ | (7,348) | |
| | | |
| Opening balance, January 1, 2021 | $ | 3,901 | | | $ | 5,155 | |
| Closing balance, December 31, 2021 | 5,741 | | | 11,686 | |
| Increase (decrease) | $ | 1,840 | | | $ | 6,531 | |
Of the total amount of customer deposit liability as of January 1, 2022, $11.1 million was reported as revenue during the year ended December 31, 2022. Of the total amount of customer deposit liability as of January 1, 2021, $4.4 million was reported as revenue during the year ended December 31, 2021.
The Company also has notes receivables under longer term financing arrangements at interest rates typically ranging from 6% to 12% with repayment terms typically ranging for 12 to 18 months.
Notes receivable at December 31, 2022 and 2021 are as follows:
| | | | | | | | | | | |
| December 31, 2022 | | December 31, 2021 |
| Notes receivable | $ | 2,464 | | | $ | 2,962 | |
| Allowance for losses | (1,250) | | | (522) | |
| Notes receivable, net | $ | 1,214 | | | $ | 2,440 | |
The following table summarizes changes in notes receivable balances that have been deemed impaired.
| | | | | | | | | | | |
| December 31,
2022 | | December 31,
2021 |
| Notes receivable | $ | 1,500 | | | $ | 1,500 | |
| Allowance for losses | (1,250) | | | (522) | |
| Notes receivable, net | $ | 250 | | | 978 | |
GROWGENERATION CORP. AND SUBSIDIARIES
NOTES TO CONSOLIDATED FINANCIAL STATEMENTS
5. PROPERTY AND EQUIPMENT
Property and equipment at December 31, 2022 and 2021 consists of the following:
| | | | | | | | | | | |
| December 31, |
| 2022 | | 2021 |
| Vehicles | $ | 2,176 | | | $ | 2,258 | |
| Buildings | 2,121 | | | 1,187 | |
| Leasehold improvements | 12,562 | | | 9,186 | |
| Furniture, fixtures and equipment | 13,195 | | | 10,992 | |
| Capitalized software | 2,644 | | | 4,753 | |
| Construction-in-progress | 9,569 | | | 2,948 | |
| 42,267 | | | 31,324 | |
| Accumulated depreciation and amortization | (13,598) | | | (7,208) | |
| | | |
| Property and equipment, net | $ | 28,669 | | | $ | 24,116 | |
Depreciation and amortization expense was $7.2 million, $3.7 million, and $1.6 million for the years ended December 31, 2022, 2021, and 2020, respectively.
6. GOODWILL AND INTANGIBLE ASSETS
The Company performs its goodwill impairment testing annually during the fourth quarter, or more frequently if events or if circumstances were to occur that would more likely than not reduce the fair value of our reporting units below its carrying amount. The Company would recognize an impairment charge for the amount by which the carrying amount exceeds the reporting unit’s fair value, not to exceed the total amount of goodwill. The adjusted carrying amount of goodwill shall be its new accounting basis.
During the second quarter of 2022, the Company’s market capitalization fell below total net assets. In addition, financial performance continued to weaken during the quarter, which was contrary to prior experience. Management reassessed business performance expectations, following persistent adverse developments in equity markets, deterioration in the environment in which we operate, inflation, lower than expected sales, and an increase in operating expenses. These indicators, in the aggregate, required impairment testing for finite-lived intangible assets at the asset group level and goodwill at the reporting unit level.
Under ASC 360, we performed a cash recoverability test on the following intangible assets: customer relationships, trade name, and non-compete. The carrying amounts of any assets that are not within the scope of ASC 360-10, other than goodwill, were adjusted for impairment, as necessary, prior to testing long-lived assets and goodwill. The Company recognized impairment losses as disclosed in the table below.
For goodwill impairment testing purposes, the Company determined four reporting units, three of which were subject to a quantitative assessment. We determined fair value using the income approach, where estimated future cash flows are discounted to present value at an appropriate rate of return. The Company completed its interim goodwill impairment test as of June 30, 2022 and recognized impairment losses as disclosed in the table below.
GROWGENERATION CORP. AND SUBSIDIARIES
NOTES TO CONSOLIDATED FINANCIAL STATEMENTS
The changes in goodwill are as follows:
| | | | | | | | | | | |
| December 31,
2022 | | December 31,
2021 |
| Balance, beginning of period | $ | 125,401 | | | $ | 62,951 | |
| Goodwill additions and measurement period adjustments | 7,234 | | | 62,450 | |
| Impairment | (116,657) | | | — | |
| Balance, end of period | $ | 15,978 | | | $ | 125,401 | |
The goodwill balance and impairment by segment are as follows:
| | | | | | | | | | | | | | |
| Retail | E-commerce | Distribution and other | Total |
| Gross carrying value December 31, 2020 | $ | 55,181 | | $ | 2,911 | | $ | 4,859 | | $ | 62,951 | |
| Acquisitions & measurement period adjustments | 46,630 | | 8,748 | | 7,072 | | 62,450 | |
| Gross carrying value December 31, 2021 | 101,811 | | 11,659 | | 11,931 | | 125,401 | |
| Acquisitions & measurement period adjustments | 1,418 | | (341) | | 6,157 | | 7,234 | |
| Gross carrying value, December 31, 2022 | $ | 103,229 | | $ | 11,318 | | $ | 18,088 | | $ | 132,635 | |
| | | | |
| Accumulated impairment losses December 31, 2020 | $ | — | | $ | — | | $ | — | | $ | — | |
| Impairment | — | | — | | — | | — | |
| Accumulated impairment losses December 31, 2021 | — | | — | | — | | — | |
| Impairment | (103,094) | | (9,848) | | (3,715) | | (116,657) | |
| Accumulated impairment losses December 31, 2022 | $ | (103,094) | | $ | (9,848) | | $ | (3,715) | | $ | (116,657) | |
| | | | |
| Net carrying value at December 31, 2021 | $ | 101,811 | | $ | 11,659 | | $ | 11,931 | | $ | 125,401 | |
| Net carrying value at December 31, 2022 | $ | 135 | | $ | 1,470 | | $ | 14,373 | | $ | 15,978 | |
A summary of intangible assets as of follows:
| | | | | | | | |
| | Weighted-Average |
| | Amortization Period |
| | of Intangible Assets |
| | as of December 31, 2022 |
| | (in years) |
| Tradenames | | 3.18 years |
| Patents, trademarks | | 3.09 years |
| Customer relationships | | 4.50 years |
| Non-competes | | 1.90 years |
| Intellectual property | | 3.16 years |
| Total | | 3.37 years |
GROWGENERATION CORP. AND SUBSIDIARIES
NOTES TO CONSOLIDATED FINANCIAL STATEMENTS
Intangible assets on the Company’s consolidated balance sheets consist of the following:
| | | | | | | | | | | | | | | | | | | | | | | | | | | | | | | | | | | |
| December 31, 2022 | | December 31, 2021 |
| Gross
Carrying
Amount | | Accumulated
Amortization | | Net
Carrying
Amount | | Gross
Carrying
Amount | | Accumulated
Amortization | | Net
Carrying
Amount |
| Tradenames | $ | 28,774 | | | $ | (10,693) | | | $ | 18,081 | | | $ | 28,300 | | | $ | (4,948) | | | $ | 23,352 | |
| Patents, trademarks | 389 | | | (56) | | | 333 | | | 100 | | | (42) | | | 58 | |
| Customer relationships | 17,102 | | | (6,501) | | | 10,601 | | | 25,175 | | | (3,055) | | | 22,120 | |
| Non-competes | 932 | | | (551) | | | 381 | | | 1,384 | | | (233) | | | 1,151 | |
| Intellectual property | 2,065 | | | (758) | | | 1,307 | | | 2,065 | | | (344) | | | 1,721 | |
| Total | $ | 49,262 | | | $ | (18,559) | | | $ | 30,703 | | | $ | 57,024 | | | $ | (8,622) | | | $ | 48,402 | |
Intangibles and impairment by segment are as follows:
| | | | | | | | | | | | | | |
| Retail | E-commerce | Distribution and other | Total |
| Gross carrying value December 31, 2020 | $ | 17,635 | | $ | — | | $ | 3,481 | | $ | 21,116 | |
| Acquisitions & measurement period adjustments | 20,190 | | 2,501 | | 13,217 | | 35,908 | |
| Gross carrying value December 31, 2021 | 37,825 | | 2,501 | | 16,698 | | 57,024 | |
| Acquisitions & measurement period adjustments | 230 | | — | | 3,182 | | 3,412 | |
| Gross carrying value, December 31, 2022 | $ | 38,055 | | $ | 2,501 | | $ | 19,880 | | $ | 60,436 | |
| | | | |
| Accumulated amortization December 31, 2020 | $ | (540) | | $ | — | | $ | (27) | | $ | (567) | |
| Amortization | (5,745) | | (354) | | (1,956) | | (8,055) | |
| Accumulated amortization December 31, 2021 | (6,285) | | (354) | | (1,983) | | (8,622) | |
| Amortization | (5,897) | | (460) | | (3,580) | | (9,937) | |
| Accumulated amortization December 31, 2022 | $ | (12,182) | | $ | (814) | | $ | (5,563) | | $ | (18,559) | |
| | | | |
| Accumulated impairment losses December 31, 2020 | $ | — | | $ | — | | $ | — | | $ | — | |
| Impairments | — | | — | | — | | — | |
| Accumulated impairment losses December 31, 2021 | — | | — | | — | | — | |
| Impairments | (11,079) | | (95) | | — | | (11,174) | |
| Accumulated impairment losses December 31, 2022 | $ | (11,079) | | $ | (95) | | $ | — | | $ | (11,174) | |
| | | | |
| Net carrying value at December 31, 2021 | $ | 31,540 | | $ | 2,147 | | $ | 14,715 | | $ | 48,402 | |
| Net carrying value at December 31, 2022 | $ | 14,794 | | $ | 1,592 | | $ | 14,317 | | $ | 30,703 | |
GROWGENERATION CORP. AND SUBSIDIARIES
NOTES TO CONSOLIDATED FINANCIAL STATEMENTS
Amortization expense for the years ended December 31, 2022, 2021, and 2020 was $9.9 million, $8.9 million, and $789 thousand respectively.
| | | | | | | | |
| Future amortization expense is as follows: | | |
| 2023 | | $ | 8,929 | |
| 2024 | | 8,813 | |
| 2025 | | 8,295 | |
| 2026 | | 3,532 | |
| 2027 | | 1,101 | |
| Thereafter | | 33 | |
| Total | | $ | 30,703 | |
7.INCOME TAXES
The provision (benefit) for income taxes for the years ended December 31, 2022, 2021, and 2020 consisted of the following:
| | | | | | | | | | | | | | | | | |
| Year Ended |
| December 31,
2022 | | December 31,
2021 | | December 31,
2020 |
| Income Tax Expense (benefit) | | | | | |
| Current federal tax expense (benefit) | | | | | |
Federal | $ | (471) | | | $ | (115) | | | $ | 1,732 | |
State | (55) | | | 949 | | | 768 | |
Deferred tax (benefit) | | | | | |
Federal | (2,179) | | | 1,473 | | | 1,706 | |
State | (180) | | | 136 | | | 227 | |
| Valuation allowance | — | | | — | | | (1,182) | |
Total | $ | (2,885) | | | $ | 2,443 | | | $ | 3,251 | |
GROWGENERATION CORP. AND SUBSIDIARIES
NOTES TO CONSOLIDATED FINANCIAL STATEMENTS
A summary of deferred tax assets and liabilities as of December 31, 2022 and 2021 is as follows:
| | | | | | | | | | | |
| Year Ended |
| December 31,
2022 | | December 31,
2021 |
| Deferred tax assets: | | | |
| Net operating losses and attributes carryovers | $ | 7,655 | | | $ | — | |
Deferred right to use lease liabilities | 12,200 | | | 11,573 | |
Stock based compensation | 1,177 | | | 974 | |
| Accumulated depreciation and amortization | 27,288 | | | — | |
Inventory reserves | — | | | 239 | |
Warranty reserves | — | | | 128 | |
Accruals and other | 2,008 | | | 1,266 | |
| 50,328 | | | 14,180 | |
| Deferred tax liabilities: | | | |
Deferred right to use lease assets | (11,638) | | | (11,147) | |
Accumulated depreciation and amortization | — | | | (5,392) | |
| (11,638) | | | (16,539) | |
| Deferred tax asset (liability) | 38,689 | | | (2,359) | |
Valuation Allowance | (38,689) | | | — | |
Deferred tax asset (liability), net | $ | — | | | $ | (2,359) | |
As of December 31, 2022, the Company had cumulative U.S. Net Operating Losses ("NOLs") consisting of carryforwards for federal income tax of $30.0 million, which have an indefinite carryforward period. As of December 31, 2022 and 2021 the Company had cumulative state net operating loss carryforwards of $28.0 million and $1.6 million. State net operating loss carryforwards will begin to expire in calendar year 2035.
NOL carryforwards may become subject to an annual limitation in the event of certain cumulative changes in the ownership interest of significant shareholders over a three-year period in excess of 50%, as defined under Sections 382 and 383 of the Internal Revenue Code, respectively, as well as similar state provisions. This could limit the amount of tax attributes that can be utilized annually to offset future taxable income or tax liabilities. The amount of the annual limitation is determined based on the value of the Company immediately prior to the ownership change. The Company has completed an analysis of any limitations on its tax attributes and has assigned a full valuation allowance against them as of December 31, 2022.
GROWGENERATION CORP. AND SUBSIDIARIES
NOTES TO CONSOLIDATED FINANCIAL STATEMENTS
The differences between the U.S. Federal statutory income tax rate and the Company’s effective tax rate were as follows for the years ended December 31, 2022 and 2021, and 2020:
| | | | | | | | | | | | | | | | | |
| Years Ended December 31, |
| 2022 | | 2021 | | 2020 |
| Federal statutory tax rate | 21 | % | | 21 | % | | 21 | % |
| State and local income taxes (net of federal tax benefit) | 5 | % | | 7 | % | | 6 | % |
| 26 | % | | 28 | % | | 27 | % |
| | | | | |
| Other | — | % | | — | % | | 6 | % |
| Stock-based compensation | (1) | % | | (8) | % | | 7 | % |
| Return to provision adjustments | 0 | % | | (4) | % | | 12 | % |
| Valuation allowance | (23) | % | | — | % | | (14) | % |
| 2 | % | | 16 | % | | 38 | % |
Uncertain Tax Benefits
The Company has not identified any uncertain tax positions as of December 31, 2022. The Company recognizes interest and penalties accrued related to uncertain tax benefits in the income tax provision. There were no Interest and penalties included in other long-term liabilities on the accompanying consolidated balance sheets for years ended December 31, 2022 and 2021. The Company did not expect any significant changes in its unrecognized tax benefits within 12 months of the reporting date. The Company files income tax returns in the U.S. federal jurisdiction and various state jurisdictions. No tax years for the Company are currently under examination by the IRS or state and local tax authorities for income tax purposes. Generally, the Company’s 2019 through 2021 fiscal years remain open for examination and assessment. For various states, the examination and assessment remain open for 2018 through 2021. Years prior to 2018 remain open solely for purpose of examination of the Company’s loss and credit carryforwards.
8. LEASES
We determine if a contract contains a lease at inception. Our material operating leases consist of retail and warehouse locations as well as office space. Our leases generally have remaining terms of 1-9 years, most of which include options to extend the leases for additional 3 to 5-year periods. Generally, the lease term is the minimum of the non-cancelable period of the lease or the lease term inclusive of reasonably certain renewal periods.
Operating lease assets and liabilities are recognized at the lease commencement date. Operating lease liabilities represent the present value of remaining lease payments over the lease term. Operating lease assets represent our right to use an underlying asset and are based upon the operating lease liabilities adjusted for prepayments or accrued lease payments, initial direct costs, lease incentives, and impairment of operating lease assets. As most of our leases do not provide an implicit rate, we use our incremental borrowing rate based on the information available at the lease start date in determining the present value of future payments. Our leases typically contain rent escalations over the lease term. We recognize expense for these leases on a straight-line basis over the lease term.
We have elected the practical expedient to account for lease and non-lease components as a single component for our entire population of leases.
Short-term expenses include only those leases with a term greater than one month and 12 months or less, and expense is recognized on a straight-line basis over the lease term. Leases with an initial term of 12 months or less, that do not include an option to purchase the underlying asset that we are reasonably certain to exercise, are not recorded on the balance sheet.
Lease expense is recorded within our consolidated statements of operations based upon the nature of the assets. Where assets are used to directly serve our customers, such as facilities dedicated to customer contracts, lease costs are recorded in “Store operations and other operating expenses.” Facilities and assets which serve management and support functions are
GROWGENERATION CORP. AND SUBSIDIARIES
NOTES TO CONSOLIDATED FINANCIAL STATEMENTS
expensed through "Selling, general, and administrative" expenses. Cash paid for amounts included in the measurement of lease liabilities for operating leases were $10.3 million and $7.2 million for the years ended December 31, 2022 and 2021.
| | | | | | | | | | | |
| December 31,
2022 | | December 31,
2021 |
| Right to use assets, operating lease assets | $ | 46,433 | | | $ | 43,730 | |
| | | |
| Current lease liability | $ | 8,131 | | | $ | 6,858 | |
| Non-current lease liability | 40,659 | | | 38,546 | |
| $ | 48,790 | | | $ | 45,404 | |
| | | | | | | | | | | |
| December 31,
2022 | | December 31,
2021 |
| Weighted average remaining lease term | 6.5 years | | 7.1 years |
| Weighted average discount rate | 5.8 | % | | 6.5 | % |
| | | | | | | | | | | | | | | | | |
| Year Ended December 31, |
| 2022 | | 2021 | | 2020 |
| Operating lease costs | $ | 10,936 | | | $ | 8,205 | | | $ | 2,801 | |
| Variable lease costs | 2,428 | | 2,130 | | 1,071 | |
| Short-term lease costs | 451 | | 205 | | 95 | |
| Total operating lease costs | $ | 13,815 | | | $ | 10,540 | | | $ | 3,967 | |
The following table presents the maturity of the Company’s operating lease liabilities as of December 31, 2022:
| | | | | |
| 2023 | $ | 10,689 | |
| 2024 | 9,805 | |
| 2025 | 8,932 | |
| 2026 | 7,429 | |
| 2027 | 5,722 | |
| Thereafter | 16,478 | |
| Total lease payments | 59,055 | |
| Less: Imputed interest | (10,265) | |
| Lease Liability at December 31, 2022 | $ | 48,790 | |
9. SHARE BASED PAYMENTS
The Company maintains long-term incentive plans for employee, non-employee members of our Board of Directors, and consultants. The Plans allows us to grant equity-based compensation awards, including stock options, stock appreciation rights, performance share units, restricted stock units, restricted stock awards, or a combination of awards (collectively, share-based awards).
On March 6, 2014, the Company’s Board of Directors (the “Board”) approved the 2014 Equity Incentive Plan (“2014 Plan”) pursuant to which the Company may grant incentive, non-statutory options, stock appreciation rights, restricted stock, restricted stock units, performance shares, performance units and other stock or cash awards to employees, non-employee members of our Board, consultants and other independent advisors who provide services to the Company. The maximum shares of common stock which may be issued over the term of the 2014 Plan shall not exceed 2,500,000 shares.
GROWGENERATION CORP. AND SUBSIDIARIES
NOTES TO CONSOLIDATED FINANCIAL STATEMENTS
Awards under the 2014 Plan are made by the Board or a committee designated by the Board. Options under the 2014 Plan are to be issued at the market price of the stock on the day of the grant except to those issued to holders of 10% or more of the Company's common stock which is required to be issued at a price not less than 110% of the fair market value on the day of the grant. Each option is exercisable at such time or times, during such period and for such numbers of shares shall be determined by the plan administrator. No option may be exercisable for more than ten years (five years in the case of an incentive stock option granted to a 10% stockholder) from the date of grant.
On January 7, 2018, the Board adopted the 2018 Equity Compensation Plan (the “2018 Plan”) and on April 20, 2018, the shareholders approved the 2018 Plan. On February 7, 2020, the Board approved the amendment and restatement of the 2018 Plan to increase the number of shares issuable thereunder from 2,500,000 to 5,000,000, which amendment was approved by shareholders on May 11, 2020. The 2018 Plan is administered by the Board. The Board may grant options to purchase shares of common stock, stock appreciation rights, restricted stock units, restricted or unrestricted shares of common stock, performance shares, performance units, other cash-based awards and other stock-based awards. The Board also has broad authority to determine the terms and conditions of each option or other kind of equity award, adopt, amend and rescind rules and regulations for the administration of the 2018 Plan and amend or modify outstanding options, grants and awards.
No options, stock purchase rights or awards may be made under the 2018 Plan on or after the ten-year anniversary of the adoption of the 2018 Plan by the Board, but the 2018 Plan will continue thereafter while previously granted options, stock appreciation rights or awards remain subject to the 2018 Plan. Options granted under the 2018 Plan may be either "incentive stock options" that are intended to meet the requirements of Section 422 of the Internal Revenue Code of 1986, as amended (the "Code") or "non-statutory stock options" that do not meet the requirements of Section 422 of the Code. The Board will determine the exercise price of options granted under the 2018 Plan. The exercise price of stock options may not be less than the fair market value, on the date of grant, per share of our common stock issuable upon exercise of the option (or 110% of fair market value in the case of incentive options granted to a 10% stockholder). No option may be exercisable for more than ten years (five years in the case of an incentive stock option granted to a 10% stockholder) from the date of grant.
The Company accounts for share-based payments through the measurement and recognition of compensation expense for share-based payment awards made to employees and directors of the Company, including stock options and restricted shares. The Company also issues share based payments in the form of common stock warrants to non-employees.
The following table presents share-based payment expense for the years ended December 31, 2022, 2021, and 2020.
| | | | | | | | | | | | | | | | | |
| December 31, |
| 2022 | | 2021 | | 2020 |
| Restricted stock | $ | 3,889 | | | $ | 4,349 | | | $ | 5,164 | |
| Stock options | 59 | | | 781 | | | 2,251 | |
| Warrants | 1,019 | | | 1,455 | | | 441 | |
| Total | $ | 4,967 | | | $ | 6,585 | | | $ | 7,856 | |
As of December 31, 2022, the Company had approximately $9.8 million of unamortized share-based compensation for option awards and restricted stock awards, which is expected to be recognized over a weighted average period of 2.6 years.
Restricted Stock
The Company issues shares of restricted stock to eligible employees, which are subject to forfeiture until the end of an applicable vesting period. The awards generally vest on the second or third anniversary of the date of grant, subject to the employee’s continuing employment as of that date. Restricted stock is valued using the Company's stock price on the grant date.
GROWGENERATION CORP. AND SUBSIDIARIES
NOTES TO CONSOLIDATED FINANCIAL STATEMENTS
Restricted stock activity for the years ended December 31, 2022 and 2021 is presented in the following table:
| | | | | | | | | | | |
| Shares | | Weighted Average Grant Date Fair Value |
| Nonvested, January 1, 2021 | 630 | | | $ | 4.51 | |
| Granted | 265 | | | 36.98 | |
| Vested | (360) | | | 8.47 | |
| Forfeited | (51) | | | 18.54 | |
| Nonvested, December 31, 2021 | 484 | | | $ | 20.19 | |
| Granted | 1,044 | | | 8.85 | |
| Vested | (399) | | | 9.26 | |
| Forfeited | (514) | | | 18.73 | |
| Nonvested, December 31, 2022 | 615 | | | $ | 9.41 | |
Stock Option
Awards issued under the 2014 and 2018 Plan as of December 31, 2022 are summarized below:
| | | | | |
| 2022 |
| Total shares available for issuance pursuant to the 2014 Plan | 2,500 | |
| Options outstanding, December 31, 2022 | — | |
| Total options exercised under 2014 Plan | (2,109) | |
| Total shares issued pursuant to the 2014 Plan | (382) | |
| Awards available for issuance under the 2014 Plan, December 31, 2022 | 9 |
| | | | | |
| 2022 |
| Total shares available for issuance pursuant to the 2018 Plan, as amended | 5,000 | |
| Options outstanding, December 31, 2022 | (604) | |
| Total options exercised under 2018 Plan | (999) | |
| Total shares issued pursuant to the 2018 Plan | (1,765) | |
| Awards available for issuance under the 2018 Plan, December 31, 2022 | 1,632 | |
The fair value of each stock option and warrant granted is estimated on the grant date using the Black-Scholes option valuation model. The assumptions used to calculate the fair value of options and warrants granted are evaluated and revised, as necessary, to reflect market conditions and the Company’s experience. Stock options and warrants are expensed on a straight-line basis over the vesting period, which is considered to be the requisite service period. There were no options or warrants issued during 2022. The following table provides the assumptions used for stock option awards.
GROWGENERATION CORP. AND SUBSIDIARIES
NOTES TO CONSOLIDATED FINANCIAL STATEMENTS
| | | | | | | | | | | | | | | | | |
| 2022 | | 2021 | | 2020 |
| Expected volatility | N/A | | N/A | | 77.8-80.70% |
| Expected dividends | N/A | | N/A | | N/A |
| Expected term | N/A | | N/A | | 2-5 years |
| Risk-free rate | N/A | | N/A | | 1.64% - 1.75% |
| | | | | |
| | | | | |
| Options outstanding pursuant to 2014 Plan | | | | | — | |
| Options outstanding pursuant to 2018 Plan | | | | | 604 | |
| Options issued outside of 2014 and 2018 Plans | | | | | — | |
| Total options outstanding December 31, 2022 | | | | | 604 | |
The table below summarizes all the options granted by the Company during years ended December 31, 2022 and 2021:
| | | | | | | | | | | | | | | | | | | | | | | | | | |
| Options | | Shares | | Weighted-
Average Exercise
Price | | Weighted- Average Remaining
Contractual Term | | Weighted-
Average Grant Date Fair Value |
| | | | | | | | |
| Outstanding at January 1, 2021 | | 1,803 | | | $ | 3.92 | | | 3.47 years | | $ | 2.38 | |
| Granted | | — | | | $ | — | | | | | $ | — | |
| Exercised | | (822) | | | $ | 3.2 | | | | | $ | 1.71 | |
| Forfeited or expired | | (75) | | | $ | 7.60 | | | | | $ | 4.53 | |
| Outstanding at December 31, 2021 | | 906 | | | $ | 4.38 | | | 2.85 years | | $ | 2.45 | |
| Vested and exercisable at December 31, 2021 | | 836 | | | $ | 4.36 | | | 2.81 years | | $ | 2.45 | |
| | | | | | | | |
| Outstanding at January 1, 2022 | | 906 | | | $ | 4.38 | | | 2.85 years | | $ | 2.45 | |
| Granted | | — | | | $ | — | | | | | $ | — | |
| Exercised | | (55) | | | $ | 4.14 | | | | | $ | 2.22 | |
| Forfeited or expired | | (247) | | | $ | 5.36 | | | | | $ | 2.97 | |
| Outstanding at December 31, 2022 | | 604 | | | $ | 3.97 | | | 1.87 years | | $ | 2.24 | |
| Vested and exercisable at December 31, 2022 | | 604 | | | $ | 3.97 | | | 1.87 years | | $ | 2.24 | |
Liability Awards
In August 2022, the Company issued certain stock awards classified as liabilities based on the guidance set forth at ASC 480-10-25 and ASC 718-10-25. These awards entitle the employees to receive a specified dollar value of common stock on future dates ranging from June 15, 2023, through June 15, 2025. The awards generally vest over three years subject to the employee’s continued employment. The aggregate face value of these awards as of December 31, 2022 amounted to $5.3 million.
During 2021, the Company issued stock awards classified as liabilities based on guidance set forth at ASC 480-10-25 and ASC 718-10-25. These awards entitled the employees to receive a specified dollar value of common stock on the vesting date and generally vested between 8 and 14 months, subject to the employee’s continuing employment as of that date. Due to their short-term nature these awards were all valued at the face value of the award. All liability awards vested at December 31, 2021 and resulted in the issuance of 34,538 shares of common stock.
GROWGENERATION CORP. AND SUBSIDIARIES
NOTES TO CONSOLIDATED FINANCIAL STATEMENTS
The Company recognizes compensation expense for these awards over the requisite service period. The expense related to liability awards for the years ended December 31, 2022, 2021, and 2020 was $0.5 million, $0.7 million, and $29.9 thousand.
10. STOCK PURCHASE WARRANTS
A summary of the status of the Company’s outstanding stock warrants as of December 31, 2022 and 2021 is as follows:
| | | | | | | | | | | |
| | | Weighted Average
Exercise
Price |
| Outstanding January 1, 2021 | 1,300 | | | $ | 8.03 | |
| Granted/issued | — | | | $ | — | |
| Exercised | (969) | | | $ | 2.84 | |
| Forfeited | — | | | $ | — | |
| Outstanding December 31, 2021 | 331 | | | $ | 22.14 | |
Granted/issued | — | | | $ | — | |
Exercised | (48) | | | $ | 3.50 | |
| Forfeited and settled | (250) | | | $ | 26.57 | |
| Outstanding December 31, 2022 | 33 | | | $ | 15.82 | |
On November 17, 2022, the Company settled 250,000 warrants for a cash payment of $10 thousand and 10,000 shares of common stock.
11. EARNINGS PER SHARE
The following table sets forth the composition of the weighted-average shares (denominator) used in the basic and dilutive earnings per share computation for the years ended December 31, 2022, 2021, and 2020.
| | | | | | | | | | | | | | | | | |
| Year Ended December 31, |
| 2022 | | 2021 | | 2020 |
| Net income (loss) | $ | (163,747) | | | $ | 12,786 | | | $ | 5,328 | |
| Weighted-average shares outstanding, basic | 60,813 | | | 59,223 | | | 43,945 | |
| Effect of dilutive outstanding warrants and stock options | — | | | 1,241 | | | 2,511 | |
| Weighted-average shares outstanding, dilutive | 60,813 | | | 60,464 | | | 46,456 | |
| Basic income per share | $ | (2.69) | | | $ | 0.22 | | | $ | 0.12 | |
| Dilutive income per share | $ | (2.69) | | | $ | 0.21 | | | $ | 0.11 | |
The following potentially outstanding restricted stock and stock options were excluded from the computation of diluted earnings per share because the effect would have been antidilutive:
| | | | | | | | | | | | | | | | | |
| | Year Ended |
| | 2022 | | 2021 | | 2020 |
| Restricted stock | 1,480 | | | — | | | — | |
| Stock options and warrants | 204 | | | — | | | — | |
| Total | 1,684 | | | — | | | — | |
GROWGENERATION CORP. AND SUBSIDIARIES
NOTES TO CONSOLIDATED FINANCIAL STATEMENTS
12. EMPLOYEE BENEFIT PLAN
The Company has a 401(k) Savings Retirement Plan that covers substantially all full-time employees who meet the plan’s eligibility requirements and provides for an employee elective contribution. The Company made matching contributions to the plan of $601 thousand, $419 thousand, and $169 thousand for the years ended December 31, 2022, 2021, and 2020, respectively.
13. VENDOR AND CUSTOMER CONCENTRATIONS
One supplier represented 24% and 28% of our total vendor purchases for the years ended December 31, 2022 and 2021, and two suppliers represented 41% of our total vendor purchases for the year ended December 31, 2020. Although the Company expects to maintain relationships with these vendors, the loss of either supplier would not be expected to have a material adverse impact on our business because of the competitive nature of the products that we sell.
No customer accounted for more than 5% of revenues for the years ended December 31, 2022, 2021, and 2020. Three customers represented 28% of total accounts receivable as of December 31, 2022.
14. ACQUISITIONS
The Company accounts for acquisitions in accordance with ASC 805, Business Combinations. Assets acquired and liabilities assumed are recorded in the accompanying consolidated balance sheets at their estimated fair values, as of the acquisition date. For all acquisitions, the preliminary allocation of the purchase price was based upon a preliminary valuation, and the Company’s estimates and assumptions are subject to change within the measurement period as valuations are finalized. Any changes to these estimates may have a material impact on the Company’s operating results or financial position. The Company has made adjustments to the preliminary valuations of the acquisition based on valuation analysis prepared by independent third-party valuation consultants. During the year ended December 31, 2022, our measurement period adjustments included increasing goodwill by $1.3 million offset with intangible assets. As a result of these measurement period adjustments, we made an insignificant reduction in amortization expense. All acquisition costs are expensed as incurred and recorded in general and administrative expenses in the consolidated statements of operations. Acquisition costs were approximately $0.2 million, $0.7 million, and $0.2 million for the years ended December 31, 2022, 2021, and 2020.
2022 Acquisitions
On February 1, 2022, the Company purchased certain net assets of Horticultural Rep Group, Inc. ("HRG"), a specialty marketing and sales organization of horticultural products based in Ogden, Utah. The total consideration for the purchase of the assets of HRG was approximately $13.4 million, including $6.8 million in cash and common stock valued at approximately $5.7 million. The Asset Purchase Agreement also provides for an indemnity holdback to be settled in common stock of the Company valued at approximately $0.9 million. Acquired goodwill of approximately $5.8 million represents the value expected to rise from organic growth and an opportunity to expand into a well-established market for the Company. HRG is included in our Distribution and other segment.
On November 3, 2022, the Company purchased certain assets of St. Louis Hydroponic Company ("STL"), a hydroponic retail store in St. Louis, Missouri. The total consideration for the purchase of the assets of STL was approximately $0.4
GROWGENERATION CORP. AND SUBSIDIARIES
NOTES TO CONSOLIDATED FINANCIAL STATEMENTS
million in cash. Acquired goodwill of approximately $0.1 million represents the value expected to rise from organic growth and an opportunity to expand into a well-established market for the Company. STL is included in our Retail segment.
The table below represents the allocation of the purchase price to the acquired net assets during the year ended December 31, 2022.
| | | | | | | | | | | | | | | | | | | | | | | | |
| | HRG | | STL | | Total | | | | | | | |
| Inventory | $ | 4,170 | | | $ | 279 | | | $ | 4,449 | | | | | | | | |
| Prepaids and other current assets | 76 | | | 10 | | | 86 | | | | | | | | |
| Furniture and equipment | 148 | | | — | | | 148 | | | | | | | | |
| Operating lease right of use asset | 666 | | | — | | | 666 | | | | | | | | |
| Operating lease liability | (666) | | | — | | | (666) | | | | | | | | |
| Customer relationships | 2,430 | | | — | | | 2,430 | | | | | | | | |
| Trademark | 496 | | | — | | | 496 | | | | | | | | |
| Non-compete | 255 | | | — | | | 255 | | | | | | | | |
| Goodwill | 5,816 | | | 135 | | | 5,951 | | | | | | | | |
| Total | $ | 13,391 | | | $ | 424 | | | $ | 13,815 | | | | | | | | |
| | | | | | | | | | | | |
The table below represents the consideration paid for the net assets acquired in business combinations.
| | | | | | | | | | | | | | | | | |
| | HRG | | STL | | Total |
| Cash | $ | 6,806 | | | $ | 424 | | | $ | 7,230 | |
| Indemnity stock holdback | 875 | | | — | | | 875 | |
| Common stock | 5,710 | | | — | | | 5,710 | |
| Total | $ | 13,391 | | | $ | 424 | | | $ | 13,815 | |
The following table discloses the date of the acquisition noted above and the revenue and earnings included in the Consolidated Statement of Operations for the year ended December 31, 2022. Revenue and earnings amounts include other proprietary brands now being included under HRG for operations.
| | | | | | | | | | | |
| | HRG | STL | Total |
| Acquisition date | February 1, 2022 | November 3, 2022 | |
| Revenue | $ | 19,239 | | $ | 178 | | $ | 19,417 | |
| Net Income (loss) | $ | (629) | | $ | 41 | | $ | (588) | |
The following represents the pro forma consolidated income statement as if the acquisitions had been included in the consolidated results of the Company for the entire period for the years ended December 31, 2022, 2021, and 2020.
| | | | | | | | | | | | | | | | | |
| December 31,
2022 (Unaudited) | | December 31,
2021 (Unaudited) | | December 31,
2020 (Unaudited) |
| Revenue | $ | 280,897 | | | $ | 441,906 | | | $ | 212,782 | |
| Net income (loss) | $ | (162,156) | | | $ | 12,198 | | | $ | 4,740 | |
GROWGENERATION CORP. AND SUBSIDIARIES
NOTES TO CONSOLIDATED FINANCIAL STATEMENTS
2021 Acquisitions
On January 25, 2021, the Company purchased the assets of Indoor Garden & Lighting, Inc ("Indoor Garden"), a two-store chain of hydroponic and equipment and indoor gardening supply stores serving the Seattle and Tacoma, Washington area. The total consideration for the purchase of Garden & Lighting was approximately $1.7 million, including approximately $1.2 million in cash and common stock valued at approximately $0.5 million. Acquired goodwill of approximately $0.7 million represents the value expected to rise from organic growth and an opportunity to expand into a well-established market for the Company. Indoor Garden is included in our Retail segment.
On February 1, 2021, the Company purchased the assets of J.A.R.B., Inc d/b/a Grow Depot Maine ("Grow Depot Maine"), a two-store chain in Auburn and Augusta, Maine. The total consideration for the purchase of Grow Depot Maine was approximately $2.1 million, including approximately $1.7 million in cash and common stock valued at approximately $0.4 million. Acquired goodwill of approximately $0.9 million represents the value expected to rise from organic growth and an opportunity to expand into a well-established market for the Company. Grow Depot Maine is included in our Retail segment.
On February 15, 2021, the Company purchased the assets of Grow Warehouse LLC ("Grow Warehouse"), a four-store chain of hydroponic and organic garden stores in Colorado (3) and Oklahoma (1). The total consideration for the purchase of Grow Warehouse was approximately $17.8 million, including approximately $8.1 million in cash and common stock valued at approximately $9.7 million. Acquired goodwill of approximately $11.1 million represents the value expected to rise from organic growth and an opportunity to expand into a well-established market for the Company. Grow Warehouse is included in our Retail segment.
On February 22, 2021, the Company purchased the assets of San Diego Hydroponics & Organics ("San Diego Hydro"), a four-store chain of hydroponic and organic garden stores in San Diego, California. The total consideration for the purchase of San Diego Hydro was approximately $9.3 million, including approximately $4.8 million in cash and common stock valued at approximately $4.5 million. Acquired goodwill of approximately $5.7 million represents the value expected to rise from organic growth and an opportunity to expand into a well-established market for the Company. San Diego Hydro is included in our Retail segment.
On March 12, 2021, the Company purchased the assets of Charcoir Corporation ("Charcoir"), which sells an RHP-certified growing medium made from the highest-grade coconut fiber. The total consideration for the purchase of Charcoir was approximately $16.4 million, including approximately $9.9 million in cash and common stock valued at approximately $6.5 million. Acquired goodwill of approximately $6.1 million represents the value expected to rise from organic growth and an opportunity to expand into a well-established distribution market for the Company of a proprietary brand. Charcoir is included in our Distribution and other segment.
On March 15, 2021, the Company purchased the assets of 55 Hydroponics ("55 Hydro"), a hydroponic and organic superstore located in Santa Ana, California. The total consideration for the purchase of 55 Hydro was approximately $6.5 million, including approximately $5.3 million in cash and common stock valued at approximately $1.1 million. Acquired goodwill of approximately $3.9 million represents the value expected to rise from organic growth and an opportunity to expand into a well-established market for the Company. 55 Hydro is included in our Retail segment.
On March 15, 2021, the Company purchased the assets of Aquarius Hydroponics ("Aquarius"), a hydroponic and organic garden store in Springfield, Massachusetts. The total consideration for the purchase of Aquarius was approximately $3.6 million, including approximately $2.3 million in cash and common stock valued at approximately $1.2 million. Acquired goodwill of approximately $1.7 million represents the value expected to rise from organic growth and an opportunity to expand into a well-established market for the Company. Aquarius is included in our Retail segment.
On March 19, 2021, the Company purchased the assets of Agron, LLC, an online seller of growing equipment. The total consideration for the purchase of Agron was approximately $11.2 million, including approximately $6.0 million in cash and common stock valued at approximately $5.3 million. Acquired goodwill of approximately $8.7 million represents the value expected to rise from organic growth and an opportunity to expand into a well-established e-commerce market for the Company targeting the commercial customer. Agron is included in our E-commerce segment.
GROWGENERATION CORP. AND SUBSIDIARIES
NOTES TO CONSOLIDATED FINANCIAL STATEMENTS
On April 19, 2021, the Company purchased the assets of Grow Depot LLC ("Down River Hydro"), a hydroponic and indoor gardening supply store in Brownstown, Michigan. The total consideration for the purchase of Down River Hydro was approximately $4.4 million, including approximately $3.2 million in cash and common stock valued at approximately $1.2 million. Acquired goodwill of approximately $2.1 million represents the value expected to rise from organic growth and an opportunity to expand into a well-established market for the Company. Down River Hydro is included in our Retail segment.
On May 24, 2021, the Company purchased the assets of The Harvest Company ("Harvest"), a northern California-based hydroponic supply center and cultivation design innovator with stores in Redding and Trinity Counties. The total consideration for the purchase of Harvest was approximately $8.3 million, including approximately $5.6 million in cash and common stock valued at approximately $2.8 million. Acquired goodwill of approximately $4.6 million represents the value expected to rise from organic growth and an opportunity to expand into a well-established market for the Company. Harvest is included in our Retail segment.
On July 19, 2021, the Company purchased the assets of Aqua Serene, Inc., ("Aqua Serene"), an Oregon corporation which consists of an indoor/outdoor garden center with stores in Eugene and Ashland, Oregon. The total consideration for the purchase was approximately $11.7 million, including approximately $9.9 million in cash and common stock valued at approximately $1.8 million. Acquired goodwill of approximately $7.0 million represents the value expected to rise from organic growth and an opportunity to expand into a well-established market for the Company. Aqua Serene is included in our Retail segment.
On July 3, 2021, the Company purchased the assets of Mendocino Greenhouse & Garden Supply, Inc ("Mendocino"), a Northern California-based hydroponic garden center located in Mendocino, California. The purchase agreement was modified on July 19, 2021 to amend the purchase price. The total consideration for the purchase was $4.0 million in cash. Acquired goodwill of approximately $2.1 million represents the value expected to rise from organic growth and an opportunity to expand into a well-established market for the Company. Mendocino is included in our Retail segment.
On August 24, 2021, the Company purchased the assets of Commercial Grow Supply, Inc. ("CGS"), a hydroponic superstore located in Santa Clarita, California. The total consideration for the purchase was approximately $7.2 million, including approximately $6.0 million in cash and common stock valued at approximately $1.3 million. Acquired goodwill of approximately $4.0 million represents the value expected to rise from organic growth and an opportunity to expand into a well-established market for the Company. CGS is included in our Retail segment.
On August 23, 2021 the Company purchased the assets of Hoagtech Hydroponics, Inc. ("Hoagtech"), a Washington -based corporation consisting of a hydroponic and garden supply center serving the Bellingham, Washington area. The total consideration for the purchase was approximately $3.9 million in cash. The Asset Purchase Agreement contains a contingent payment equal to $0.6 million to be settled in common stock of the Company if this garden supply center reaches $8.0 million in revenue within a 12-month calendar period from the date of close. The Company used a third-party specialist to value this contingent consideration. The probability that the target will be reached was determined to be 5% which resulted in a value of approximately $28.5 thousand of contingent consideration which was added to goodwill. Acquired goodwill of approximately $4.6 million represents the value expected to rise from organic growth and an opportunity to expand into a well-established market for the Company. Hoagtech is included in our Retail segment.
On October 15, 2021, the Company purchased the assets of Indoor Store, LLC ("All Seasons Gardening"), an indoor-outdoor garden supply center specializing in hydroponics systems, lighting, and nutrients. All Seasons Gardening is the largest hydroponics retailer in New Mexico. The total consideration for the purchase was approximately $0.9 million, including approximately $0.7 million in cash and common stock valued at approximately $0.2 million. Acquired goodwill of approximately $0.5 million represents the value expected to rise from organic growth and an opportunity to expand into a well-established market for the Company. All Seasons is included in our Retail segment.
On December 31, 2021, the Company purchased the assets of Mobile Media, Inc ("MMI"), a mobile shelving manufacturing and warehouse facility. The total consideration for the purchase was approximately $9.1 million, including approximately $8.3 million in cash and common stock valued at approximately $0.8 million. Acquired goodwill of approximately $1.2 million represents the value expected to rise from organic growth and an opportunity to expand into a well-established market for the Company. MMI is included in our Distribution and other segment.
GROWGENERATION CORP. AND SUBSIDIARIES
NOTES TO CONSOLIDATED FINANCIAL STATEMENTS
The table below represents the allocation of the purchase price to the acquired net assets during the year ended December 31, 2021:
| | | | | | | | | | | | | | | | | | | | | | | | | | | | | | | | | | | | | | | | | | | | | | | | | | | | | |
| Agron | | Aquarius | | 55 Hydro | | Charcoir | | San Diego Hydro | | Grow Warehouse | | Grow Depot Maine | | Indoor Garden | | Downriver |
| Inventory | $ | — | | | $ | 957 | | | $ | 780 | | | $ | 839 | | | $ | 1,400 | | | $ | 2,450 | | | $ | 326 | | | $ | 372 | | | $ | 824 | |
| Prepaids and other current assets | 46 | | | 12 | | | 29 | | | 534 | | | 36 | | | 30 | | | 3 | | | — | | | 3 | |
| Furniture and equipment | 29 | | | 63 | | | 50 | | | — | | | 315 | | | 250 | | | 25 | | | 94 | | | 50 |
| Liabilities | — | | | — | | | — | | | — | | | — | | | (169) | | | — | | | — | | | — | |
| Operating lease right of use asset | 98 | | | 108 | | | 861 | | | — | | | 1,079 | | | 641 | | | 92 | | | 137 | | | 273 | |
| Operating lease liability | (98) | | | (108) | | | (861) | | | — | | | (1,079) | | | (641) | | | (92) | | | (137) | | | (273) | |
| Customer relationships | 832 | | | 339 | | | 809 | | | 5,712 | | | 605 | | | 1,256 | | | 549 | | | 210 | | | 634 | |
| Trade name | 1,530 | | | 485 | | | 870 | | | 1,099 | | | 1,192 | | | 2,748 | | | 344 | | | 353 | | | 698 | |
| Non-compete | 139 | | | — | | | 26 | | | — | | | 6 | | | 94 | | | 36 | | | 2 | | | 16 | |
| Intellectual property | — | | | — | | | — | | | 2,065 | | | — | | | — | | | — | | | — | | | — | |
| Goodwill | 8,673 | | | 1,702 | | | 3,915 | | | 6,119 | | | 5,728 | | | 11,120 | | | 866 | | | 661 | | | 2,126 | |
| Total | $ | 11,249 | | | $ | 3,558 | | | $ | 6,479 | | | $ | 16,368 | | | $ | 9,282 | | | $ | 17,779 | | | $ | 2,149 | | | $ | 1,692 | | | $ | 4,351 | |
| | | | | | | | | | | | | | | | | | | | | | | | | | | | | | | | | | | | | | | | | | | | | | | | | | | | | |
| Harvest | | Aquaserene | | Mendocino | | CGS | | Hoagtech | | All Seasons | | MMI | | | | Total |
| Inventory | $ | 1,204 | | | 1,696 | | | 753 | | | 875 | | | 751 | | | 100 | | | 3,530 | | | | | $ | 16,857 | |
| Prepaids and other current assets | 7 | | | 2 | | | 1 | | | 1 | | | 37 | | | 1 | | | — | | | | | 742 | |
| Furniture and equipment | 100 | | | 500 | | | 160 | | | 100 | | | 144 | | | 25 | | | 328 | | | | | 2,233 | |
| Liabilities | — | | | — | | | — | | | — | | | (29) | | | — | | | (250) | | | | | (448) | |
| Operating lease right of use asset | 3,782 | | | 1,177 | | | 408 | | | 746 | | | 1,569 | | | 37 | | | 2,332 | | | | | 13,340 | |
| Operating lease liability | (3,782) | | | (1,177) | | | (408) | | | (746) | | | (1,569) | | | (37) | | | (2,332) | | | | | (13,340) | |
| Customer relationships | 1,016 | | | 1,235 | | | 575 | | | 1,382 | | | 493 | | | 154 | | | 2,964 | | | | | 18,765 | |
| Trade name | 1,392 | | | 1,231 | | | 414 | | | 852 | | | 428 | | | 117 | | | 1,039 | | | | | 14,792 | |
| Non-compete | — | | | 11 | | | 6 | | | 11 | | | 3 | | | — | | | 238 | | | | | 588 | |
| Intellectual property | — | | | — | | | — | | | — | | | — | | | — | | | — | | | | | 2,065 | |
| Goodwill | 4,606 | | | 6,976 | | | 2,091 | | | 4,027 | | | 2,105 | | | 545 | | | 1,202 | | | | | 62,462 | |
| Total | $ | 8,325 | | | 11,651 | | | 4,000 | | | $ | 7,248 | | | 3,932 | | | 942 | | | $ | 9,051 | | | | | $ | 118,056 | |
| | | | | | | | | | | | | | | | | |
The table below represents the consideration paid for the net assets acquired in business combinations during 2021:
| | | | | | | | | | | | | | | | | | | | | | | | | | | | | | | | | | | | | | | | | | | | | | | | | | | | | |
| Agron | | Aquarius | | 55 Hydro | | Charcoir | | San Diego Hydro | | Grow Warehouse | | Grow Depot Maine | | Indoor Garden | | Downriver |
| Cash | $ | 5,973 | | | $ | 2,331 | | | $ | 5,347 | | | $ | 9,902 | | | $ | 4,751 | | | $ | 8,100 | | | $ | 1,738 | | | $ | 1,165 | | | $ | 3,177 | |
| Common stock | 5,276 | | | 1,227 | | | 1,132 | | | 6,466 | | | 4,531 | | | 9,679 | | | 411 | | | 527 | | | 1,174 | |
| Total | $ | 11,249 | | | $ | 3,558 | | | $ | 6,479 | | | $ | 16,368 | | | $ | 9,282 | | | $ | 17,779 | | | $ | 2,149 | | | $ | 1,692 | | | $ | 4,351 | |
GROWGENERATION CORP. AND SUBSIDIARIES
NOTES TO CONSOLIDATED FINANCIAL STATEMENTS
| | | | | | | | | | | | | | | | | | | | | | | | | | | | | | | | | | | | | | | | | | | | | | | | | | | | | |
| Harvest | | Aquaserene | | Mendocino | | CGS | | Hoagtech | | All Seasons | | MMI | | | | Total |
| Cash | $ | 5,561 | | | $ | 9,860 | | | $ | 4,000 | | | $ | 5,976 | | | $ | 3,932 | | | $ | 701 | | | $ | 8,270 | | | | | $ | 80,784 | |
| Common stock | 2,764 | | | 1,791 | | | — | | | 1,272 | | | — | | | 241 | | | 781 | | | | | 37,272 | |
| Total | $ | 8,325 | | | $ | 11,651 | | | $ | 4,000 | | | $ | 7,248 | | | $ | 3,932 | | | $ | 942 | | | $ | 9,051 | | | | | $ | 118,056 | |
The following table discloses the date of the acquisitions noted above and the revenue and earnings included in the consolidated income statement from the date of acquisition to the period ended December 31, 2021.
| | | | | | | | | | | | | | | | | | | | | | | | | | | | | | | | | | | | | | | | | | | | | | | | | | | | | |
| Agron | | Aquarius | | 55 Hydro | | Charcoir | | San Diego Hydro | | Grow Warehouse LLC | | Grow Depot Maine | | Indoor Garden | | Downriver |
| Acquisition date | 3/19/2021 | | 3/15/2021 | | 3/15/2021 | | 3/12/2021 | | 2/22/2021 | | 2/15/2021 | | 2/1/2021 | | 1/25/2021 | | 3/31/2021 |
| Revenue | $ | 14,403 | | | $ | 9,640 | | | $ | 6,017 | | | $ | 6,840 | | | $ | 7,173 | | | $ | 13,147 | | | $ | 6,655 | | | $ | 6,265 | | | $ | 3,663 | |
| Net Income (loss) | $ | (305) | | | $ | 1,679 | | | $ | 399 | | | $ | 1,039 | | | $ | 906 | | | $ | 2,175 | | | $ | 1,132 | | | $ | 1,088 | | | $ | 297 | |
| | | | | | | | | | | | | | | | | | | | | | | | | | | | | | | | | | | | | | | | | | | | | | | | | | | | | |
| Harvest | | Aquaserene | | Mendocino | | CGS | | Hoagtech | | All Seasons | | MMI | | | | Total |
Acquisition date | 5/3/21 | | 7/19/21 | | 7/19/21 | | 8/24/21 | | 8/23/21 | | 10/15/21 | | 12/31/21 | | | | |
Revenue | $ | 6,706 | | | $ | 2,742 | | | $ | 1,455 | | | $ | 1,534 | | | $ | 1,564 | | | $ | 187 | | | $ | — | | | | | $ | 87,991 | |
| Net Income (loss) | $ | 924 | | | $ | 445 | | | $ | 106 | | | $ | 15 | | | $ | 141 | | | $ | 52 | | | $ | — | | | | | $ | 10,093 | |
The following represents the pro forma consolidated income statement as if the acquisitions had been included in the consolidated results of the Company for the entire period for the years ended December 31, 2021 and 2020.
| | | | | | | | | | | |
| December 31,
2021 (Unaudited) | | December 31,
2020 (Unaudited) |
| Revenue | $ | 452,126 | | | $ | 310,947 | |
| Net income | $ | 13,511 | | | $ | 18,480 | |
2020 Acquisitions
On February 26, 2020, the Company purchased the assets of Health & Harvest LLC ("Health & Harvest"). The total consideration for the purchase was approximately $2.9 million, including approximately $1.8 million in cash and common stock valued at approximately $1.1 million. Acquired goodwill represents the value expected to rise from organic growth and the opportunity to expand into a well-established market for the Company.
On June 16, 2020, we acquired certain assets of H2O Hydroponics, LLC (“H2O Hydro”). The total consideration for the purchase was approximately $2.0 million, including approximately $1.3 million in cash and common stock valued at approximately $0.7 million. Acquired goodwill represents the value expected to rise from organic growth and the opportunity to expand into a well-established market for the Company.
On August 10, 2020, we acquired certain assets of Benzakry Family Corp, d/b/a Emerald City Garden (“Emerald City”). The total consideration for the purchase was approximately $1.0 million. Acquired goodwill represents the value expected to rise from organic growth and the opportunity to expand into a well-established market for the Company.
On October 12, 2020, the Company acquired the assets of Hydroponics Depot, LLC (“Hydro Depot”), a single store located in Phoenix, AZ. The total consideration for the purchase was approximately $1.5 million, including approximately $1.0 million in cash and common stock valued at approximately $0.5 million. Acquired goodwill represents the value expected to rise from organic growth and the opportunity to expand into a well-established market for the Company.
GROWGENERATION CORP. AND SUBSIDIARIES
NOTES TO CONSOLIDATED FINANCIAL STATEMENTS
On October 20, 2020 the Company acquired the assets of Big Green Tomato (“BGT”), a two-store chain in Battle Creek and Taylor, Michigan. The total consideration was approximately $9.0 million, including approximately $6.0 million in cash and shares of common stock valued at approximately $3.1 million. Acquired goodwill of approximately $4.0 million represents the value expected to rise from organic growth and an opportunity to expand into a well-established market for the Company.
On November 17, 2020, the Company acquired the assets of The GrowBiz (“GrowBiz”), a five-store chain with four stores in California and one store in Oregon. The total consideration for the purchase of GrowBiz was approximately $44.8 million, including approximately $17.5 million in cash and common stock valued at approximately $27.3 million. Acquired goodwill of approximately $28.5 million represents the value expected to rise from organic growth and an opportunity to expand into a well-established market for the Company.
On December 14, 2020, the Company acquired the assets of Grassroots Hydroponics, Inc. ("Grassroots"), a three-store chain in California. The total consideration for the purchase of Grassroots was approximately $10.0 million, approximately $7.5 million in cash and common stock valued at approximately $2.5 million. Acquired goodwill of approximately $4.5 million represents the value expected to rise from organic growth and an opportunity to expand into a well-established market for the Company.
On December 23, 2020, the Company acquired the assets of Canopy Crop Management (“Canopy”) and its complete portfolio of products including the Power SI brand of silicic acid-enriched fertilizers. The total consideration for the purchase of Canopy was approximately $9.2 million, including approximately $5.4 million in cash and common stock valued at approximately $3.8 million. Acquired goodwill of approximately $4.9 million represents the value expected to rise from organic growth and an opportunity to expand into a well-established product distribution market for the Company.
The table below represents the allocation of the purchase price to the acquired net assets during the year ended December 31, 2020:
| | | | | | | | | | | | | | | | | | | | | | | | | | | | | | | | | | | | | | | | | | | | | | | | | | | | | |
| Canopy | | Grassroots | | GrowBiz | | BGT | | Hydro Depot | | Emerald
City | | H2O
Hydro | | Health &
Harvest | | Total |
| Inventory | $ | 899 | | | $ | 2,348 | | | $ | 6,286 | | | $ | 1,595 | | | $ | 333 | | | $ | 150 | | | $ | 498 | | | $ | 1,054 | | | $ | 13,163 | |
| Prepaids and other current assets | — | | | — | | | — | | | — | | | — | | | — | | | 4 | | | — | | | 4 | |
| Building | — | | | — | | | — | | | 477 | | | — | | | — | | | — | | | — | | | 477 | |
| Furniture and equipment | — | | | 150 | | | 200 | | | 250 | | | 25 | | | 10 | | | 50 | | | 51 | | | 736 | |
| Operating lease right to use asset | — | | | 1,437 | | | 3,641 | | | 246 | | | — | | | 140 | | | 906 | | | 324 | | | 6,694 | |
| Operating lease liability | — | | | (1,437) | | | (3,641) | | | (246) | | | — | | | (140) | | | (906) | | | (324) | | | (6,694) | |
| Customer relationships | 2,274 | | | 768 | | | 1,969 | | | 634 | | | 148 | | | 212 | | | 150 | | | 255 | | | 6,410 | |
| Trade name | 1,094 | | | 2,140 | | | 7,483 | | | 1,953 | | | 212 | | | — | | | 234 | | | 357 | | | 13,473 | |
| Non-compete | 113 | | | 133 | | | 372 | | | 96 | | | 19 | | | 14 | | | 43 | | | 6 | | | 796 | |
| Goodwill | 4,860 | | | 4,461 | | | 28,476 | | | 4,039 | | | 799 | | | 614 | | | 1,008 | | | 1,131 | | | 45,388 | |
| Total | $ | 9,240 | | | $ | 10,000 | | | $ | 44,786 | | | $ | 9,044 | | | $ | 1,536 | | | $ | 1,000 | | | $ | 1,987 | | | $ | 2,854 | | | $ | 80,447 | |
The table below represents the consideration paid for the net assets acquired in business combinations during 2020:
| | | | | | | | | | | | | | | | | | | | | | | | | | | | | | | | | | | | | | | | | | | | | | | | | | | | | |
| Canopy | | Grassroots | | GrowBiz | | BGT | | Hydro Depot | | Emerald
City | | H2O
Hydro | | Health &
Harvest | | Total |
| Cash | $ | 5,424 | | | $ | 7,499 | | | $ | 17,487 | | | $ | 5,972 | | | $ | 988 | | | $ | 1,000 | | | $ | 1,282 | | | $ | 1,750 | | | $ | 41,402 | |
| Common stock | 3,816 | | | 2,501 | | | 27,299 | | | 3,072 | | | 548 | | | — | | | 705 | | | 1,104 | | | 39,045 | |
| Total | $ | 9,240 | | | $ | 10,000 | | | $ | 44,786 | | | $ | 9,044 | | | $ | 1,536 | | | $ | 1,000 | | | $ | 1,987 | | | $ | 2,854 | | | $ | 80,447 | |
GROWGENERATION CORP. AND SUBSIDIARIES
NOTES TO CONSOLIDATED FINANCIAL STATEMENTS
The following table discloses the date of the acquisitions noted above and the revenue and earnings included in the consolidated income statement from the date of acquisition to the period ended December 31, 2020:
| | | | | | | | | | | | | | | | | | | | | | | | | | | | | | | | | | | | | | | | | | | | | | | | | | | | | |
| Canopy | | Grassroots | | GrowBiz | | BGT | | Hydro Depot | | Emerald
City | | H2O
Hydro | | Health &
Harvest | | Total |
| Acquisition date | 12/23/2020 | | 12/14/2020 | | 11/17/2020 | | 10/20/2020 | | 10/12/2020 | | 8/10/2020 | | 6/16/2020 | | 2/26/2020 | | |
| Revenue | $ | 301 | | | $ | 532 | | | $ | 3,852 | | | $ | 1,859 | | | $ | 1,245 | | | $ | 5,635 | | | $ | 2,418 | | | $ | 8,995 | | | $ | 24,837 | |
| Net Income | $ | 141 | | | $ | 74 | | | $ | 736 | | | $ | 188 | | | $ | 149 | | | $ | 1,005 | | | $ | 562 | | | $ | 1,066 | | | $ | 3,921 | |
The following represents the pro forma consolidated income statement as if the acquisitions had been included in the consolidated results of the Company for the entire period for the year ended December 31, 2020.
| | | | | |
| December 31,
2020 (Unaudited) |
| Revenue | $ | 309,486 | |
| Earnings | $ | 18,308 | |
15. STOCKHOLDERS EQUITY
On December 11, 2020, the Company consummated an underwritten public offering of 5,750,000 shares of its common stock (the “Shares”), which included the exercise in full of the underwriters’ option to purchase an additional 750,000 shares of common stock to cover over-allotments. The Shares were sold at a public offering price of $30 per share, generating gross proceeds of $172.5 million, before deducting the underwriting discounts and commissions and other offering expenses. Net proceeds from the sales of common stock, net of all offering costs and expenses, was approximately $162.5 million.
On July 2, 2020, the Company consummated an underwritten public offering of 8,625,000 shares of its common stock (the “Shares”), which included the exercise in full of the underwriters’ option to purchase an additional 1,125,000 shares of common stock to cover over-allotments. The Shares were sold at a public offering price of $5.60 per share, generating gross proceeds of $48.3 million, before deducting the underwriting discounts and commissions and other offering expenses. Net proceeds from the sales of common stock, net of all offering costs and expenses, was approximately $44.6 million.
16. RELATED PARTIES
The Company has engaged with a firm that employs an immediate family member of an officer of the Company as partner. The firm provides certain legal services. Amounts paid to that firm in total were approximately $0.3 million for the year ended December 31, 2022. As of December 31, 2022, there was an outstanding balance of $26 thousand due.
17. SEGMENTS
As discussed in Note 2, at December 31, 2021, the Company had two reportable segments which increased to three at March 31, 2022, based on quantitative and qualitative analyses. The Company now also reports E-commerce as a reportable segment. The Company has three primary reportable segments including retail operations, e-commerce and all other which includes the distribution of proprietary brands to wholesale accounts. The Company has segmented its operations to reflect the manner in which management reviews and evaluates the results of its operations. The structure reflects the manner in which the chief operating decision maker regularly assesses information for decision-making purposes, including the allocation of resources. Shared services and other corporate costs are allocated to individual segments based on that segment's profitability.
GROWGENERATION CORP. AND SUBSIDIARIES
NOTES TO CONSOLIDATED FINANCIAL STATEMENTS
Retail: The core of our business strategy is to operate the largest chain of retail garden centers in the U.S. The hydroponic retail landscape is fragmented, which allows us to acquire “best of breed” hydroponic retail operations and leverage efficiencies of a centralized organization. During 2022, the Company acquired or opened 5 new locations and expanded its physical retail presence into 4 new states. Our plan is to continue to acquire, open and operate garden centers and related businesses throughout the U.S. However, in light of persistent difficult market conditions, the Company also closed 8 underperforming retail locations in 2022 and may consider additional store consolidation in 2023. Some of our garden centers have multi-functions, with added capabilities that include warehousing, distribution and fulfillment for our online platforms and direct fulfillment to our commercial customers.
Our retail segment also includes our commercial sales organization, which is focused on selling products and services, including end-to-end solutions, for large commercial cultivators outside of the physical retail network. When a commercial customers gain new cultivation licenses, they need lighting, benching, environmental control systems, irrigation, fertigation and other products to outfit their facilities. Existing facilities also need consumable products for operations, as well as equipment updates from time to time. Commercial customers typically purchase large dollar amounts and sizes of products. We offer commercial customers volume pricing, terms and financing.
E-commerce: Our digital strategy is primarily focused on capturing the home, craft and commercial grower online. GrowGeneration.com offers thousands of hydroponic products, all curated by our product team. GrowGeneration.com offers customers the option to have their orders shipped directly to their locations, anywhere in North America. GrowGeneration also sells its products through its distribution website, HRGdist.com, and online marketplaces such as Amazon and Walmart.
Distribution and other: In December 2020, GrowGeneration purchased the business of Canopy Crop Management Corp., the developer of the popular PowerSi line of monosilicic acid products, a widely used nutrient additive for plants. In March 2021, the Company purchased Charcoir, a line of premium coco pots, cubes and medium. In December 2021, the Company purchased the assets of Mobile Media, Inc. ("MMI"), a mobile shelving and storage solutions developer and manufacturer. In February 2022, the Company purchased the assets of Horticultural Rep Group, Inc. ("HRG"), a specialty marketing and sales organization of horticultural products. The Company is in the process of combining the operations and management of these non-retail enterprises. The products these companies provide are integrated into our retail, e-commerce, and direct sales activities and we receive incremental revenue from the sale of these products.
GROWGENERATION CORP. AND SUBSIDIARIES
NOTES TO CONSOLIDATED FINANCIAL STATEMENTS
Disaggregated revenue by segment is presented in the following table:
| | | | | | | | | | | |
| December 31, |
| 2022 | 2021 | 2020 |
| Sales, net | | | |
| Retail | | | |
| Private label sales | $ | 24,712 | | $ | 22,077 | | $ | 1,786 | |
| Non-private label sales | 180,807 | | 347,109 | | 176,797 | |
| Total retail | 205,519 | | 369,186 | | 178,583 | |
| E-Commerce | | | |
| Private label sales | 1,168 | | 802 | | — | |
| Non-private label sales | 13,903 | | 35,410 | | 14,482 | |
| Total e-commerce | 15,071 | | 36,212 | | 14,482 | |
| Distribution and other | | | |
| Private label sales | 11,026 | | 17,091 | | 300 | |
| Non-private label sales | 14,065 | | — | | — | |
| Commercial fixture sales | 32,485 | | — | | — | |
| Total distribution and other | 57,576 | | 17,091 | | 300 | |
| Total | $ | 278,166 | | $ | 422,489 | | $ | 193,365 | |
Selected information by segment is presented in the following tables:
| | | | | | | | | | | |
| December 31, |
| 2022 | 2021 | 2020 |
| Sales, net | | | |
| Retail | $ | 205,519 | | $ | 369,186 | | $ | 178,583 | |
| E-Commerce | 15,071 | | 36,212 | | 14,482 | |
| Distribution and other | 57,576 | | 17,091 | | 300 | |
| Total | $ | 278,166 | | $ | 422,489 | | $ | 193,365 | |
| | | | | | | | | | | |
| December 31, |
| 2022 | 2021 | 2020 |
| Gross profit | | | |
| Retail | $ | 48,804 | | $ | 101,384 | | $ | 47,127 | |
| E-Commerce | 3,851 | | 9,876 | | 3,728 | |
| Distribution and other | 17,608 | | 6,981 | | 193 | |
| Total | $ | 70,263 | | $ | 118,241 | | $ | 51,048 | |
GROWGENERATION CORP. AND SUBSIDIARIES
NOTES TO CONSOLIDATED FINANCIAL STATEMENTS
| | | | | | | | | | | |
| December 31, |
| 2022 | 2021 | 2020 |
| Income (Loss) from operations | | | |
| Retail | $ | (149,122) | | $ | 13,098 | | $ | 9,264 | |
| E-Commerce | (12,589) | | (975) | | (999) | |
| Distribution and other | (6,164) | | 2,879 | | 172 | |
| Total | $ | (167,875) | | $ | 15,002 | | $ | 8,437 | |
The Company does not evaluate segments by assets as it is not practical and does not inform any of our decision making processes. The chief operating decision maker in the Company neither reviews nor requests this information.
GROWGENERATION CORP. AND SUBSIDIARIES
NOTES TO CONSOLIDATED FINANCIAL STATEMENTS
18. COMMITMENTS AND CONTINGENCIES
Legal Matters
We are involved in lawsuits and claims which arise in the normal course of our business, including the initiation and defense of proceedings related to contract and employment disputes. In our opinion, these claims individually and in the aggregate are not expected to have a material adverse effect on our financial condition, results of operations or cash flows.
In December 2021, the Company was sued in the U.S. District Court for the Southern District of Texas related to a Promissory Note & Asset Acquisition Rights Option (“Note & Option”) with TGC Systems, LLC (“Total Grow”). The Texas case has been dismissed and the parties are currently engaged in arbitration pursuant to the arbitration clause of the Note & Option. Among other claims, Total Grow alleges that the Company is liable to Total Grow based on promissory estoppel and breach of contract for failing to consummate the acquisition of Total Grow by the Company. The Company believes that the claims against it are without merit and is vigorously defending against them. The Company is also counterclaiming for repayment of $1,500,000 principal plus interest loaned by the Company to Total Grow pursuant to the Note & Option. The Company has accrued a reserve of $1.3 million against the Note & Option.
There can be no assurance that future developments related to pending claims or claims filed in the future, whether as a result of adverse outcomes or as a result of significant defense costs, will not have a material effect on the Company’s financial condition, results of operations or cash flows. We believe that our assessment of contingencies is reasonable and that the related accruals, in the aggregate, are adequate; however, there can be no assurance that the final resolution of these matters will not have a material effect on our financial condition, results of operations or cash flows.
Indemnifications
In the ordinary course of its business, the Company makes certain indemnities under which it may be required to make payments in relation to certain transactions. As of December 31, 2022, the Company did not have any liabilities associated with indemnities.
In addition, the Company, as permitted under Colorado law and in accordance with its amended and restated certificate of incorporation and amended and restated bylaws, in each case, as amended to date, indemnifies its officers and directors for certain events or occurrences while the officer or director is or was serving at the Company’s request in such capacity. The duration of these indemnifications varies. The Company has a director and officer insurance policy that may enable it to recover a portion of any future amounts paid. The Company accrues for losses for any known contingent liability, including those that may arise from indemnification provisions, when future payment is probable. No such losses have been recorded to date.
GROWGENERATION CORP. AND SUBSIDIARIES
NOTES TO CONSOLIDATED FINANCIAL STATEMENTS
ITEM 9. CHANGES IN AND DISAGREEMENTS WITH ACCOUNTANTS ON ACCOUNTING AND FINANCIAL DISCLOSURE
See report on Form 8-K filed on March 28, 2022 regarding change in Accountants.
ITEM 9A. CONTROLS AND PROCEDURES
Evaluation of Disclosure Controls and Procedures
Disclosure controls and procedures (as defined in Rules 13a-15(e) and 15d-15(e) of the Securities Exchange Act of 1934, as amended (the “Exchange Act”)) are controls and other procedures designed to ensure that information required to be disclosed in our reports under the Exchange Act is recorded, processed, summarized and reported within the time periods specified in the rules and forms of the SEC, and that such information is accumulated and communicated to our management to allow timely decisions regarding required disclosure.
As of December 31, 2022, an evaluation was conducted under the supervision and with the participation of our management, including our Chief Executive Officer and Chief Financial Officer, of the effectiveness of our disclosure controls and procedures (as defined in Rule 13a-15(e) and Rule 15d-15(e) of the Exchange Act). Our management concluded that as of December 31, 2022 our disclosure controls and procedures were not effective because of the material weaknesses in our internal control over financial reporting described below.
Management’s Report on Internal Control Over Financial Reporting
The Company’s management is responsible for establishing and maintaining adequate internal control over financial reporting, as such term is defined in Rules 13a-15(f) and 15d-15(f) under the Exchange Act. The Company’s internal control over financial reporting is a process designed by or under the supervision of the Company’s Chief Executive Officer and Chief Financial Officer, and overseen by the Board of Directors, to provide reasonable assurance regarding the reliability of financial reporting and the preparation of financial statements for external purposes in accordance with GAAP and includes policies and procedures that:
•Pertain to the maintenance of records that, in reasonable detail, accurately and fairly reflect the transactions and dispositions of the Company’s assets;
•Provide reasonable assurance that transactions are recorded as necessary to permit preparation of financial statements in accordance with GAAP, and that the Company’s receipts and expenditures are being made only in accordance with the authorization of its management and directors; and
•Provide reasonable assurance regarding prevention or timely detection of unauthorized acquisition, use or disposition of the Company’s assets that could have a material effect on the financial statements.
Because of its inherent limitations, internal control over financial reporting is not intended to provide absolute assurance that a misstatement of the Company’s consolidated financial statements would be prevented or detected. Also, projections of any evaluation of effectiveness to future periods are subject to the risk that controls may become inadequate because of changes in conditions, or that the degree of compliance with the policies or procedures may deteriorate.
A material weakness is a deficiency, or combination of deficiencies, in internal control over financial reporting, such that there is a reasonable possibility that a material misstatement of the annual or interim financial statements will not be prevented or detected on a timely basis.
Management conducted an evaluation of the effectiveness of the Company’s internal control over financial reporting using the criteria in Internal Control - Integrated Framework 2013 issued by the Committee of Sponsoring Organizations of the Treadway Commission (the “COSO Framework”). As a result of this evaluation, management concluded that the Company’s internal control over financial reporting was not effective as of December 31, 2022 because of the material weaknesses in internal control over financial reporting discussed below.
•Control Environment: The Company did not maintain an effective control environment based on the criteria established in the COSO framework, which resulted in deficiencies in principles associated with the control environment.
In addition, the following material weaknesses were previously identified and contributed to the material weakness in the control environment:
•Insufficient resources within the accounting and financial reporting department to review the accounting of complex financial reporting transactions including areas such as business combinations, share based compensation and the related income tax reporting
•Ineffective controls over updating and distributing accounting policies and procedures across the organization.
The control environment material weaknesses contributed to other material weaknesses within our system of internal controls over financial reporting related to the following COSO components:
•Risk Assessment: The Company did not design and implement an effective risk assessment based on the criteria established in the COSO framework and identified deficiencies in the principles associated with the risk assessment component of the COSO framework.
•Information and Communication: The Company did not have an effective information and communication process that identified and assessed the source of and controls necessary to ensure the reliability of information used in financial reporting and that communicates relevant information about roles and responsibilities for internal control over financial reporting.
•Monitoring Activities: The Company did not have effective monitoring activities to assess the operation of internal control over financial reporting, including the continued appropriateness of control design and level of documentation maintained to support control effectiveness.
•Control Activities: As a consequence of the material weaknesses described above, internal control deficiencies related to the design and operation of process-level controls and general information technology controls were determined to be pervasive throughout the Company’s financial reporting processes.
In addition, the following material weaknesses were previously identified and contributed to the material weakness in control activities:
•Inadequate information and technology general controls, including segregation of duties, change management, and user access, which were inadequate to support financial reporting applications and support automated controls and functionality.
•Inadequate controls over physical inventory counts.
•Inadequate controls over valuations, inclusive of appropriate valuation model inputs and appropriate forecasting for prospective financial information.
•Inadequate segregation of duties within human resources, manual journal entry posting processes, and various bank accounts of the Company to prevent and detect unauthorized transactions in a timely manner.
While these material weaknesses did not result in material misstatements of the Company’s consolidated financial statements as of and for the year ended December 31, 2022, these material weaknesses create a reasonable possibility that a material misstatement of account balances or disclosures in annual or interim consolidated financial statements may not be prevented or detected in a timely manner.
The Company’s independent registered public accounting firm, Grant Thornton LLP, which audited the 2022 consolidated financial statements included in this Form 10-K, has expressed an adverse opinion on the Company's internal control over financial reporting.
Remediation Plan and Status
Our management is committed to remediating identified control deficiencies (including both those that rise to the level of a material weakness and those that do not), fostering continuous improvement in our internal controls and enhancing our overall internal controls environment.
Through the full year of 2022, the Company initiated and will continue efforts toward implementation of certain steps in its remediation plan, including:
•Engaged a third-party CPA firm to assist with the redesign of the Sarbanes-Oxley program inclusive of entity-level controls.
•Created and staffed a controls compliance analyst charged with monitoring and facilitating compliance with the Company’s responsibilities under the Sarbanes Oxley Act of 2002 (“SOX”).
•Implemented a global risk and compliance software to assist in monitoring and documenting compliance with SOX.
•For certain processes, developed new and revised existing process narratives and identified risks inherent to those processes.
•Developed new controls and revised the design of existing controls for a significant number of relevant key controls to mitigate the aforementioned risks, inclusive of general information technology controls and entity-level controls.
•Certain business functions have been restructured or consolidated to align more closely with effective business operation as well as to enable appropriate segregation of duties.
The following remaining activities are scheduled to occur in the first half of 2023 in anticipation of conducting management’s testing that will begin in the first half of 2023 in support of issuing management’s assessment of internal control over financial reporting as of December 31, 2023:
•Conduct initial organization-wide training sessions with all control owners.
•Implementation of new business systems to support information technology general controls.
•Completion of the identification of risks arising from inappropriate segregation of duties and fraud risks.
•Completion of risk assessment and control design for the remaining populations of processes and controls.
•Implementation of controls across all financial reporting processes and information technology environments.
•Development of effective communication plans relating to, among other things, identification of deficiencies and recommendations for corrective actions. These plans will apply to all parties responsible for remediation.
•Implement periodic compliance reports are made to the Nominating and Governance Committee of the Board of Directors.
•Ongoing training with control owners, as necessary.
•Ongoing migration of certain components of a legacy information technology system onto a common information technology environment, including risk assessment, control design and implementation of new and revised controls.
Our management believes that these remediation actions, when fully implemented, will remediate the material weaknesses we have identified and strengthen our internal control over financial reporting. Our remediation efforts are ongoing and additional remediation initiatives may be necessary. We will continue our initiatives to implement and document the strengthening of existing, and development of new policies, procedures, and internal controls.
Remediation of the identified material weaknesses and strengthening our internal control environment will require a substantial effort throughout 2023. We will test the ongoing operating effectiveness of the new and existing controls in future periods. The material weaknesses cannot be considered completely remediated until the applicable controls have operated for a sufficient period of time and management has concluded, through testing, that these controls are operating effectively.
While we believe the steps taken to date and those planned for implementation will remediate the ineffectiveness of our internal control over financial reporting, we have not completed all remediation efforts identified herein. Accordingly, as we continue to monitor the effectiveness of our internal control over financial reporting in the areas affected by the material weaknesses described above, we have and will continue to perform additional procedures prescribed by management, including the use of manual mitigating control procedures and employing any additional tools and resources deemed necessary, to ensure that our consolidated financial statements are fairly stated in all material respects.
Item 9B. Other Information.
None.
Item 9C. Disclosure Regarding Foreign Jurisdictions that Prevent Inspections
None.
PART III
ITEM 10. DIRECTORS, EXECUTIVE OFFICERS AND CORPORATE GOVERNANCE
Other than as provided below, the information required by Items 401, 405, 406 and 407 (c)(3); (d)(4) and (d)(5) of Regulation S-K is incorporated into this Annual Report on Form 10-K by reference to the Company’s Definitive Proxy Statement for its 2023 Annual Meeting of Shareholders to be filed within 120 days following December 31, 2022.
All directors of the Company hold office for one-year terms until the election and qualification of their successors. Officers are appointed by our Board and serve at the discretion of the Board, subject to applicable employment agreements. The following table sets forth information regarding our executive officers and the members of our Board.
| | | | | | | | | | | | | | |
| Name | | Age | | Position |
| Darren Lampert | | 62 | | Chief Executive Officer and Director |
| Michael Salaman | | 60 | | President and Director |
| Gregory Sanders | | 34 | | Chief Financial Officer |
| Eula Adams | | 73 | | Director |
| Stephen Aiello | | 62 | | Director |
| Paul Ciasullo | | 64 | | Director |
Darren Lampert has been our Chief Executive Officer and a Director since our inception in 2014. Mr. Lampert began his career in 1986 as a founding member of the law firm of Lampert and Lampert (1986-1999), where he concentrated on securities litigation, NASD (now FINRA) compliance and arbitration and corporate finance matters. Mr. Lampert has represented clients in actions and investigations brought before government agencies and self-regulatory bodies. From 1999 to 2014, Mr. Lampert worked as a portfolio manager and proprietary trader at a number of broker-dealer firms. From 2010 to 2014, Mr. Lampert was a private investor. Mr. Lampert graduated in 1982 with a Bachelor of Science degree in business administration from Ithaca College. Mr. Lampert received a J.D. from Bridgeport University School of Law in 1985. Mr. Lampert was admitted to practice law in New York in 1986 and is also admitted to practice before the United States District Courts for the Southern and Eastern Districts of New York.
Michael Salaman has been our President and a Director since our inception. Mr. Salaman served as the Chairperson of Skinny Nutritional Corp. from 2002 to 2014 and as Chief Executive Officer and President of Skinny Nutritional Corp. from 2010 to 2014. Skinny Nutritional Corp. filed for Chapter 11 Bankruptcy protection in 2013 and the assets were sold to a private equity firm in 2014. Mr. Salaman has over 20 years’ experience in the area of start-ups, new product development, distribution and marketing. Mr. Salaman began his business career as Vice President of Business Development for National Media Corp., an infomercial marketing company in the United States, from 1985 to 1993. From 1993 to 1995, Mr. Salaman worked as a consultant. From 1995 to 2001, Mr. Salaman started a digital media company called American Interactive Media, Inc., a developer of Web TV set-top boxes and ISP services. In 2002, Mr. Salaman became the principal officer of that entity, directing its operations as a marketing and distribution company, and in 2005 focused its efforts in the enhanced water business. Mr. Salaman received a Bachelor of Business Administration degree in business from Temple University in 1986.
Gregory Sanders has been Chief Financial Officer of the Company since August 2022. Immediately prior, Mr. Sanders served as Vice President and Corporate Controller at GrowGeneration for nearly five years. He came to GrowGeneration with prior public company experience, having served in various accounting positions for Enterprise Holdings and Arrow Electronics. Mr. Sanders also led the Finance and Accounting Department, as well as Administrative and Human Resources functions, for Machol & Johannes LLC. Mr. Sanders holds a B.S. in Accounting from the University of Minnesota.
Eula Adams has been a Director of the Company since September 2021. Mr. Adams began his career as an auditor at Touche Ross in 1972, eventually becoming an audit partner there (which became Deloitte & Touche following a merger in 1989) until 1991. From 1991 to 2003, Mr. Adams worked at First Data Corporation (now Fiserv), holding positions as President of Merchant Services, President of Card Issuer Services and President of Teleservices. From 2004 to 2008, Mr. Adams served as Senior Vice President at Sun Microsystems responsible for systems, software and data storage. From 2008 to 2013, Mr. Adams was Chief Operating Officer of Xcore Corporation. Most recently, Mr. Adams was Chief Executive Officer and director at Neuromonics, Inc. from 2013 to 2019. Mr. Adams currently serves on the board of directors of Your Way Cannabis Brands Inc., as well as the White House Historical Association and the Transportation Commission of Colorado. Mr. Adams is a graduate of Morris Brown College with a Bachelor of Science degree in accounting, has a Master of Business Administration from Harvard Business School, and is a Certified Public Accountant.
Stephen Aiello has been a Director of the Company since 2014. Mr. Aiello has been a private investor focusing on cannabis and real estate since 2008. Mr. Aiello was a partner at Jones and Company from 2004 to 2008. From 2001 to 2003, he worked at 033 Asset Management, a long/short equity fund where he was responsible for day-to-day trading of the portfolio. From 1986 to 2001, he was a partner at Montgomery Securities, where he managed the sales and trading institutional desk. Mr. Aiello received a Bachelor of Arts in Psychology from Ithaca College and a Master of Business Administration from Fordham University.
Paul Ciasullo has been a Director of the Company since 2020. He has also been a board member of Leafline Labs, LLC since 2018. In 2010, Mr. Ciasullo founded Wallstreet Research Solutions, LLC, which provided sales, marketing and customer account services primarily in partnership with a fixed income research firm specializing in bond and loan covenants called Covenant Review, LLC (with which he had been working to build the business since 2007). Covenant Review and Wallstreet Research Solutions merged and later re-branded as Fulcrum Financial Data LLC, where Mr. Ciasullo acted as President of Global Marketing and Sales and was a board member from 2014 to 2018 when the company was sold to Fitch Ratings Services. From 2005 to 2006, Mr. Ciasullo was a Managing Director at Soleil Securities Group Inc., responsible for developing a strategy for bringing alternative research such as industry knowledge into a stock research environment. From 2000 to 2004, Mr. Ciasullo was a founder of and acted as President of CreditSights, Inc., an institutional investment research firm specializing in fixed income research for institutional investors. Prior to that, Mr. Ciasullo held a number of Managing Director positions as head of trading at large brokerage firms. Mr. Ciasullo graduated from Brown University in 1981 with a Bachelor of Arts in Economics and International Relations.
ITEM 11. EXECUTIVE COMPENSATION
The information required by Item 402 of Regulation S-K is incorporated into this Annual Report Form 10-K by reference to the Definitive Proxy Statement for its 2023 Annual Meeting of Shareholders to be filed within 120 days following December 31, 2022.
ITEM 12. SECURITY OWNERSHIP OF CERTAIN BENEFICIAL OWNERS AND MANAGEMENT AND RELATED STOCKHOLDER MATTERS
The information required by Item 201(d) and Item 403 of Regulation S-K is incorporated into this Annual Report Form 10-K by reference to the Definitive Proxy Statement for its 2023 Annual Meeting of Shareholders to be filed within 120 days following December 31, 2022.
ITEM 13. CERTAIN RELATIONSHIPS AND RELATED TRANSACTIONS AND DIRECTOR INDEPENDENCE
The information required by Items 404 and 407(a) of Regulation S-K is incorporated into this Annual Report Form 10-K by reference to the Definitive Proxy Statement for its 2023 Annual Meeting of Shareholders to be filed within 120 days following December 31, 2022.
ITEM 14. PRINCIPAL ACCOUNTANT FEES AND SERVICES
The information required by Item 9(e) of Schedule 14A is incorporated into this Annual Report Form 10-K by reference to the Definitive Proxy Statement for its 2023 Annual Meeting of Shareholders to be filed within 120 days following December 31, 2022.
PART IV
ITEM 15. EXHIBITS, FINANCIAL STATEMENT SCHEDULES
| | | | | |
| 3.1 | |
| |
| 3.2 | |
| |
| 10.1 | |
| |
| 10.2 | |
| |
| 10.3 | |
| |
| 10.4 | |
| |
| 10.6 | |
| |
| 10.7 | |
| |
| 10.8 | |
| |
| 21.1 | |
| |
| 23.1 | |
| |
| 23.2 | |
| |
| 31.1 | |
| |
| 31.2 | |
| |
| 32.1 | |
| |
| 32.2 | |
| |
| 101.INS | XBRL Instance Document (Filed herewith.) |
| |
| 101.SCH | XBRL Taxonomy Extension Schema Document (Filed herewith.) |
| |
| 101.CAL | XBRL Taxonomy Extension Calculation Linkbase Document (Filed herewith.) |
| |
| 101.LAB | XBRL Taxonomy Extension Label Linkbase Document (Filed herewith.) |
| |
| 101.PRE | XBRL Taxonomy Extension Presentation Linkbase Document (Filed herewith.) |
| |
| 101.DEF | XBRL Taxonomy Extension Definition Linkbase Definition (Filed herewith.) |
ITEM 16. FORM 10-K SUMMARY
None.
SIGNATURES
Pursuant to the requirements of Section 13 or 15(d) of the Exchange Act, the registrant has duly caused this report to be signed on its behalf by the undersigned thereunto duly authorized on March 15, 2023.
| | | | | | | | | | | |
| GROWGENERATION CORP. |
| |
| By: | /s/ Darren Lampert |
| | Name: | Darren Lampert |
| | Title: | Chief Executive Officer
(Principal Executive Officer) |
| | |
| By: | /s/ Gregory Sanders |
| | Name: | Gregory Sanders |
| | Title: | Chief Financial Officer
(Principal Accounting Officer and Principal Financial Officer) |
KNOW ALL MEN BY THESE PRESENTS, that we, the undersigned officers and directors GrowGeneration Corp., a Colorado corporation (the “Registrant”), do hereby constitute and appoint Darren Lampert and Gregory Sanders, and each of them, as his or her true and lawful attorney-in-fact and agents, with full power of substitution and re-substitution, for him and in his name, place, and stead, in any and all capacities, to sign any and all amendments to this Annual Report on Form 10-K, and to file the same, with all exhibits thereto, and other documents in connection therewith, with the Securities and Exchange Commission, granting unto said attorneys-in-fact and agents, and each of them, full power and authority to do and perform each and every act and thing requisite and necessary to be done in connection therewith, as fully to all intents and purposes as he might or could do in person, hereby ratifying and confirming that all said attorneys-in-fact and agents, or any of them or their or his substitute or substitutes, may lawfully do or cause to be done by virtue hereof.
Pursuant to the requirements of the Securities Exchange Act of 1934, this Annual Report on Form 10-K has been signed below by the following persons on behalf of the Registrant and in the capacities and on the dates indicated.
| | | | | | | | | | | | | | |
| Person | | Capacity | | Date |
| | | | |
| /s/ Darren Lampert | | Chief Executive Officer and Director
(Principal Executive Officer)
| | March 15, 2023 |
| Darren Lampert | | |
| | | | |
| /s/ Gregory Sanders | | Chief Financial Officer
(Principal Financial and Accounting Officer)
| | March 15, 2023 |
| Gregory Sanders | | |
| | | | |
| /s/ Michael Salaman | | President and Director | | March 15, 2023 |
| Michael Salaman | | |
| | | | |
| /s/ Stephen Aiello | | Director | | March 15, 2023 |
| Stephen Aiello | | |
| | | | |
| /s/ Paul Ciasullo | | Director | | March 15, 2023 |
| Paul Ciasullo | | |
| | | | |
| /s/ Eula Adams | | Director | | March 15, 2023 |
| Eula Adams | | |